close

EEE

EEE

Power Quality Aspects of Smart Grids

Introduction

There is at the moment no consistent definition of “a smart grid” or “the smart grid”. Different people use different definitions, and the definitions develop with time. In this paper, we will simply limit ourselves to a description, and not worry about a precise definition. The term “smart grid” refers to a way of operating the power system using communication technology, power electronic technologies, and storage technologies to balance production and consumption at all levels, i.e. from inside of the customer premises all the way up to the highest voltage levels. An alternative way of defining the concept is as the set of technologies, whatever they may be, that are needed to allow new types of production and new types of consumption to be integrated in the electric power system. The concept of “smart grid” was started from a number of the technology innovations in the power industry. It is a result of the new technologies applied in power systems, including renewable energy sources generation, distributed generation, and the latest information and communication technology. With the (technical and regulatory) developments of renewable energy generation technologies, the penetration level of especially wind power have becomes very high in some parts of the system. Similar developments are expected for solar power and domestic combined heat and power. However, the increase in intermittent, non-predictable and non-dispatch able energy generation puts highest requirements on power balance control, from primary control through operational planning. The traditional control and communication system needs to be improved to accommodate for a high penetration of renewable energy sources. The term “micro grid” is used to describe a customer owned installation containing generation as well as consumption, where there is a large controllability of the exchange of power between the micro grid and the rest of the grid. Such micro grids provide the possibilities of load-shifting and peak-shaving through demand side management. Consumers could use the electricity from their own sources or even sell electricity to the grid during the peaking periods, hence increase the energy efficiency and defer the investments in transmission and distribution networks. To perform demand response in a most efficient way, the market and system operation conditions need to be known. Smart meters / advanced metering infrastructure (AMI) and two-way communication technologies can provide consumers and operators the information for decision making. The automation system of the traditional power system is still based on the design and operation of the system as it was decades ago. The latest developments in information and communication technologies have only found very limited implementation in the power system automation. One of the objectives of smart grid is to update the power system automation (including transmission, distribution, substation, individual feeders and even individual customers) using the latest technology.

Besides technology innovations, another important reason for smart grid is to improve the services in power supply to consumers. Through AMI (also known as “smart meters”), consumers are no longer passive consumers. They can monitor their own voltage and power and manage their energy consumption for example based on the electricity prices. Feedback on consumption is also seen as an important tool for energy saving.

 Balancing Production and Consumption

Any amount of production or consumption can be connected at any location in the power system provided the difference between these two remains within certain band. The unbalance between production and consumption at a certain location is provided by the transfer capacity from the rest of the system. The situation can be more complicated in meshed systems, but this is the basic rule. Traditionally, production capacity and consumption demand have been seen as independent of each other. So the traditional grid has been designed to cope with the maximum amount of production, and also with the maximum amount of consumption. This approach sets hard limits on both production and consumption. A “smart grid” that can control, or influence, both production and consumption would allow more of both to be integrated into the power system. To accomplish this goal, communication technology may be order to inform or encourage changes in production (i.e. generator units) and consumption (i.e. customers or devices). Most published studies propose some kind of market mechanism to maintain balance between production and consumption, but more direct methods are also possible, with either the network operator or an independent entity taking control.

Different methods are available to balance consumption and production while at the same time optimizing energy efficiency, reliability and/or power quality.

  • Physical energy storage, for example in the form of batteries or pumped-storage hydro. Such storage could be owned and operator by a customer (an end-user or a generator company), owned by a customer and operated by the network operator, or owned and operated by the network operator.
  • Virtual energy storage, by shifting of energy consumption to a later or earlier moment in time. Charging of car batteries is often mentioned, but this method of virtual storage can also be used for cooling or heating loads. It is important to realize that this approach does not result in energy saving, but in more efficient use of the generation facilities and the power system transport capacity. The total energy consumption may be reduced somewhat, for example by reduced losses, reduced average temperatures with heating systems (increased with cooling), and the ability to use more efficient forms of energy, but these are minor effects and they should not be seen as the main reason for introducing the new technology.
  • Load shedding, where load is removed from the system when all other methods fail. This method is available now but is rarely used in most countries.

Accepting the occasional small amount of load shedding may, in some cases save large investments in the power system. (In some developing countries, uncontrolled and inadvertent load shedding often occurs automatically during grid or generator overload, but this is a poor example of load shedding, and hopefully only a temporary situation.)Under-frequency load shedding, as used in almost all systems, can be seen as an extreme case of reserve capacity in the form of load shedding. This is not the kind of application that is normally considered in the discussion on smart grids. Curtailment of production: For renewable sources like sun and wind, the primary energy is usually transformed into electricity whenever it is available. But if generation exceeds consumption, renewable sources may be turned off, or curtailed. The term “spilled wind” is sometimes used to express this concept.

Shifting of production: for sources like natural gas (for combined-heat-and-power) or hydro power, the primary energy source can be temporarily stored, then used at a later time. Not using the primary energy sources will make it available at a later time.

 Power Quality

In the ongoing discussions about smart grids, power quality has to become an important aspect and should not be neglected. An adequate power quality guarantees the necessary compatibility between all equipment connected to the grid. It is therefore an important issue for the successful and efficient operation of existing as well as future grids. However power quality issues should not form an unnecessary barrier against the development of smart grids or the introduction of renewable sources of energy. The “smart” properties of future grids should rather be a challenge for new approaches in an efficient management of power quality. Especially the advanced communication technologies can establish new ways for selective power quality management.

Power quality covers two groups of disturbances:

variations and events. While variations are continuously measured and evaluated, events occur in general unpredictable and require a trigger action to be measured. Important variations are: slow voltage changes, harmonics, flicker and unbalance. Important events are rapid voltage changes, dips, swells and interruptions.

The actual power quality (i.e. the disturbance levels) results from the interaction between the network and the connected equipment.

All three areas are expected to see significant changes in the future. This means that power quality issues will also change with the consecutive development of future grids. The following comments shall give some examples for possible future developments in power quality.

Generating Equipment

The penetration of micro generation (typically defined as generation with a rated power of less than 16 A per phase) in the low-voltage networks is expected to increase continuously. In domestic installations this will be mainly single phase equipment based on self-commutating inverters with switching frequencies in the range of several kHz. Emissions in the range of low order harmonics can usually be neglected. The emissions shift into the range of higher frequencies, possibly between 2 and 9 kHz, where a serious discussion is needed on the choice of appropriate limits.

Furthermore micro-generation equipment will often be connected single-phase. This could increase the negative-sequence and zero-sequence voltage in the low-voltage grid. In weak distribution networks, existing limits could be exceeded rather quickly. Reconsidering the limits for negative-sequence voltages and introducing limits for zero-sequence voltage could be possible needed.

 Consumer Equipment

The introduction of new and more efficient technologies is the main driver for changes in consumer equipment. One widely-discussed example is the change from incandescent lamps to energy saving lamps. Compact fluorescent lamps are at the moment the main replacement for incandescent lamps, but they are probably only an intermediate step before the LED-technique will become widely accepted. Seen from the network, each of the new lamp technologies results in the replacement of a resistive load by a rectifier load. The fundamental current is reduced significantly whereas the harmonic currents are increased. High penetration together with high coincidence of operation may lead to an increase of low order harmonics. Several network operators fear an increase of especially the fifth harmonic voltage above the compatibility levels. Discussion is ongoing in IEC working groups about the need for additional emission requirements on new types of lighting of low wattage. The same would hold for other improved (energy-efficient drives) or new (photovoltaic, battery chargers for electric and hybrid cars) equipment.

As mentioned before, such limits should however not result in unnecessary barriers against the introduction of new equipment. Alternative paths, like an increase of the compatibility levels for some higher harmonics, should at least be considered.

 Distribution Network

The short-circuit power is an important factor in power quality management. Under constant emission a higher short circuit power results in a better voltage quality. Today the short-circuit power is mainly determined by the upstream network. In the IEC electromagnetic-compatibility standards reference impedance is used as a link between compatibility levels (voltages) and emission limits (currents). In future grids with high penetration of generation significant differing supply scenarios may be possible, from supply by a strong upstream network to an islanded (self-balanced) operation. This may lead to a significantly higher variability in short circuit power than today. Thus the approach based on fixed reference impedances may be inadequate or the use of high emitting loads may only be acceptable for certain operational states of the network or only in conjunction with power quality conditioners (owned by a customer, by the network operator, or by a third party).Due to the continuous decrease of resistive loads providing damping stability issues may become important for low-voltage networks too. In conjunction with increasing capacitive load (the EMC filters of electronic equipment) resonance points with decreasing resonant frequencies as well as lower damping can appear.

 Power-Quality Monitoring

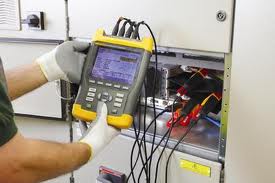
Growing service quality expectations and reduced possibilities for grid enforcements make advanced distribution automation (ADA) an increasingly necessary development for network operators and the next large step in the evolution of the power systems to smart grids. The management of the distribution system is mainly based on the information collected from the power flows by an integrated monitoring system. This enables real-time monitoring of grid conditions for the power system operators. It also enables automatic reconfiguration of the network to optimize the power delivery efficiency and to reduce the extent and duration of interruptions. The basic part of the monitoring system infrastructure is based on sensors, transducers, intelligent electronic devices (IED) and (revenue) meters collecting information throughout the distribution system.

A number of network operators have already proposed that the smart grid of the future should include:

  • Network monitoring to improve reliability
  • Equipment monitoring to improve maintenance
  • Product (power) monitoring to improve PQ

In order to achieve these goals, the actual distribution system infrastructure (especially meters and remotely controlled IEDs) should be used to gather as much information as possible related to network, equipment and product (i.e. power quality and reliability) to improve the distribution system overall performance.

Among the most important ADA operating systems, that a smart grid will include, it can be mentioned:

  • Volt & var control (VVC)&Fault location (FL)
  • Network reconfiguration or self-healing

Network operators with an ambitious energy efficiency program have focused on two targets:

  • Capacitor banks installation
  • Voltage control

There is also another important goal: to reduce the duration of interruptions. To answer to these challenges, pilot projects are being conducted on conservation voltage reduction and fault location based on power quality related measurements provided by IEDs and revenue meters.

The VVC system requires a permanent monitoring of the voltage magnitude (averaged over 1 to 5 min) at the end of the distribution feeder and the installation of switched capacitor banks. Besides that, the monitoring allows the detection of power quality disturbances such as long-duration under voltages and overvoltage, and voltage and current unbalance.

Basically, the voltage regulation system at the substation is replaced with an intelligent system that uses network measurements to maintain a voltage magnitude for all customers within the acceptable upper and lower limits. The VVC system also analyzes the reactive-power requirements of the network and orders the switching of capacitor banks when required. An important goal is to prevent potential power quality problems due to the switching operations of capacitor banks. Another goal was to evaluate the joint impact of the VVC system and voltage dips occurring on the grid.

The results of the study indicate that the impact can be quantified by two effects:&Increasing number of shallow voltage dips is expected. Voltage reduction from 2 to 4% is obtained due to VVC system. Added to this is the voltage drop due to the fault: drops of 6 to 15% (not counted as dips) become drops of 15 to 12% (which are counted as dips).&Equipment malfunctioning or tripping: the joint contribution of the VVC system and the disturbance brings the residual voltage level below a critical threshold, around 75% of the nominal voltage for many devices.

Fault location is based either on a voltage drop fault location technique that uses waveforms from distributed power quality measurements along the feeder or on a fault current technique based on the measurement of the fault current at the substation. According to the average error in locating the fault with the first technique was less than 2%, in terms of the average main feeder length. An accurate fault-location technique results in a significant reduction in the duration of (especially) the longer interruptions.

The information collected by the fault-location system can also be used for calculating dip related statistics and help to better understand the grid behavior. The third application, network reconfiguration or self-healing, is based either on local intelligence (belonging to major distribution equipment controllers) or on decisions taken at the power system control center, which remotely controls and operates the equipment used for network reconfiguration (recloses and switches).The impact of these applications on the distribution network and its customers is permanently evaluated. The infrastructure belonging to ADA systems can be shared by a power-quality monitoring system capable of real time monitoring. Depending on the type of ADA application or system, the monitoring can be done either at low-voltage or at medium-voltage level. In the first case monitoring devices may belong to an Advanced Metering Infrastructure (AMI) and in the second case they may belong to the distribution major equipment itself.

The smart grid will allow a continuous power-quality monitoring that will not improve directly the voltage quality but will detect quality problems helping to mitigate them.

 Different Power-Quality Issues

Emission by New Devices

When smart grids are introduced, we expect growth both in production at lower voltage levels (distributed generation) and in new types of consumption (for example, charging stations for electric vehicles, expanded high-speed railways, etc.). Some of these new types of consumption will emit power-quality disturbances, for example harmonic emission. Preliminary studies have shown that harmonic emission due to distributed generation is rather limited. Most existing end-user equipment (computer, television, lamps, etc.) emit almost exclusively at the lower odd integer harmonics (3, 5, 7, 9 etc.), but there are indications that modern devices including certain types of distributed generators emit a broadband spectrum. Using the standard methods of grouping into harmonic and interharmonic groups and subgroups below 2 kHz will result in high levels for even harmonics and interharmonics. For frequencies above 2 kHz high levels have been observed for the 255-Hz groups. An example is shown in Fig. 5.3: the spectrum of the emission by a group of three full-power converter wind turbines, where 1 A is about 1% of the rated current.

The emission is low over the whole spectrum, being at most 5.5% of the nominal current. The combination of a number of discrete components at the characteristic harmonics (5 and 7, 11 and 13, 17 and 19, etc.) together with a broadband spectrum over a wide frequency range, is also being emitted by other equipment like energy-efficient drives, micro generators, and photo-voltaic installations. The levels are not always as low as for the example shown here. The existing compatibility levels are very low for some frequencies, as low as 5.2%.Harmonic resonances are more common at these higher frequencies so that any reference impedance for linking emission limits to compatibility levels should be set rather high. Keeping strict to existing compatibility limits and existing methods of setting emission limits could put excessive demands on new equipment. The measurement of these low levels of harmonics at higher frequencies will be more difficult than for the existing situation with higher levels and lower frequencies. This might require the development of new measurement techniques including a closer look at the frequency response of existing instrument transformers. The presence of emission at higher frequencies than before also calls for better insight in the source impedance at these frequencies: at the point of connection with the grid as well as at the terminals of the emitting equipment.

 Interference between Devices and Power-Line-Communication

Smart grids will depend to a large extent on the ability to communicate between devices, customers, distributed generators, and the grid operator. Many types of communication channels are possible Power-line communication might seem an obvious choice due to its easy availability, but choosing power-line communication could introduce new disturbances in the power system, resulting in a further reduction in power quality. Depending on the frequency chosen for power-line communication, it may also result in radiated disturbances, possibly interfering with radio broadcasting and communication. It is also true that modern devices can interfere with power-line-communication, either by creating a high disturbance level at the frequency chosen for power-line communication or by creating a low-impedance path, effectively shorting out the power-line communication signal. The latter seems to be the primary challenge to power-line communication today. So far, there have been no reports of widespread interference with sensitive equipment caused by power line-communication, but its increased use calls for a detailed study.

 Allocation of Emission Limits

When connecting a new customer to the power system, an assessment is typically made of the amount of emission that would be acceptable from this customer without resulting in unacceptable levels of voltage disturbance for other customers. For each new customer a so-called emission limit is allocated. The total amount of acceptable voltage distortion is divided over all existing and future customers. This assumes however that it is known how many customers will be connected in the future .With smart grids; the amount of consumption will have no limit provided it is matched by a similar growth in production. This continued growth in both production and consumption could lead to the harmonic voltage distortion becoming unacceptably high. Also the number of switching actions will keep on increasing and might reach unacceptable values. One may say that production and consumption are in balance at the power-system frequency, but not at harmonic frequencies. Another way of looking at this is that the system strength is no longer determined by the maximum amount of consumption and/or production connected downstream, but by the total amount of harmonic emission coming from downstream equipment. This will require a different way of planning the distribution network.

 Improving Voltage Quality

One aim of smart grids is to improve the performance of the power system (or to prevent deterioration) without the need for large investments in lines, cables, transformers, etc. From a customer viewpoint, the improvements can be in terms of reliability, voltage quality or price. All other improvements (e.g. in loading of cables or transformers, protection coordination, operational security, efficiency) are secondary to the customer.

Improvements in reliability and price are discussed in detail in several other papers and beyond the scope of this paper. The only voltage-quality improvement expected to be made by smart grids in the near future would be a reduction in longer-term voltage-magnitude variations. In theory, both under voltages and over voltages might be mitigated by keeping the correct local balance between production and consumption. For rural networks, overvoltage and under voltages are the main limitation for increasing consumption and production. These networks should therefore be addressed first. The same balance between “production” and “consumption” can in theory also be used for the control of harmonic voltages. When the harmonic voltage becomes too large, either an emitting source could be turned off, or a harmonic filter could be turned on, or a device could be turned on that emits in opposite phase (the difference between these solutions is actually not always easy to see). Smart grid communication and control techniques, similar to those used to balance consumption and production (including market rules), could be set up to reduce harmonic emissions. This could be a solution for the growing harmonic emission with growing amounts of production and consumption. Micro grids with islanding capability can, in theory, mitigate voltage dips by going very quickly from grid-connected operation to island operation. The presence of generator units close to the loads allows the use of these units in maintaining the voltage during a fault in the grid.

 Immunity of devices

Simultaneous tripping of many distributed generators due to a voltage-quality disturbance (like a voltage dip) is the subject of active discussion .This problem is far from solved. As a smart grid attempts to maintain a balance between production and consumption, mass tripping of consumption could have similar adverse consequences. This should be further investigated. Simultaneous tripping of many distributed generators due to a voltage-quality disturbance (like a voltage dip) is the subject of active discussion. This problem is far from solved. As a smart grid attempts to maintain a balance between production and consumption, mass tripping of consumption could have similar adverse consequences. This should be further investigated.

 Weakening of the Transmission Grid

The increased use of distributed generation and of large wind parks will result in a reduction of the amount of conventional generation connected to the transmission system. The fault level will consequently be reduced, and power-quality disturbances will spread further. This will worsen voltage dips, fast voltage fluctuations (flicker) and harmonics. The severity of this has been studied for voltage dips. The conclusion from the study is that even with 25% wind power there is no significant increase in the number of voltage dips due to faults in the transmission system.

 Summary

The new technology associated with smart grids offers the opportunity to improve the quality and reliability as experience by the customers. It wills however also result in the increase of disturbance levels in several cases and thereby introduce a number of new challenges. But these new challenges should definitely not be used as arguments against the development of smart grids. However they should attract attention to the importance of power quality for the successful and reliable operation of smart grids. New developments need new approaches and perspectives from all parties involved (network operators, equipment manufacturers, customers, regulators, standardization bodies, and others).

Power Quality

read more
EEE

The Role of Electricity Infrastructure in Reducing Greenhouse Gas Emissions by Smart Grid

Introduction

Most of the world’s electricity system was built when primary energy was relatively inexpensive. Grid reliability was mainly ensured by having excess capacity in the system, with unidirectional electricity flow to consumers from centrally dispatched power plants. Investments in the electric system were made to meet increasing demand—not to change fundamentally the way the system works. While innovation and technology have dramatically transformed other industrial sectors, the electric system, for the most part, has continued to operate the same way for decades. This lack of investment, combined with an asset life of 47 or more years, has resulted in an inefficient and increasingly unstable system. Climate change, rising fuel costs, outdated grid infrastructure, and new power generation technologies have changed the mindset of all stakeholders:

  • Electric power causes approximately 25 percent of global greenhouse gas emissions, and utilities are rethinking what the electricity system of the future should look like.$Renewable and distributed power generation will play a more prominent role in reducing greenhouse gas emissions.
  • Demand-side management promises to improve energy efficiency and reduce overall electricity consumption.
  • Real-time monitoring of grid performance will improve grid reliability and utilization, reduce blackouts, and increase financial returns on investments in the grid.

These changes on both the demand and supply side require a new, more intelligent system that can manage the increasingly complex electric grid.

Recognizing these challenges, the energy community is starting to marry information and communications technology (ICT) with electricity infrastructure. Technology enables the electric system to become smart. Near-real-time information allows utilities to manage the entire electricity system as an integrated framework, actively sensing and responding to changes in power demand, supply, costs, quality, and emissions across various locations and devices. Similarly, better information enables consumers to manage energy use to meet their needs. According to former U.S. Vice President Al Gore, “Just as a robust information economy was triggered by the introduction of the Internet; a dynamic, new, renewable energy economy can be stimulated by the development of an electranet or Smart Grid.

The potential environmental and economic benefits of a Smart Grid are significant. A recent Pacific Northwest National Laboratory study provided homeowners with Smart Grid technologies to monitor and adjust the energy consumption in their homes. The average household reduced its annual electric bill by 17 percent. If widely deployed, this approach could reduce peak loads on utility grids up to 15 percent annually, which equals more than 177 gigawatts, or the need to build 177 large coal-fired power plants over the next 27 years in the United States alone. This could save up to $277 billion in capital expenditures on new plant and grid investments, and take the equivalent of 37 million autos off the road.

 Opportunities for Improvement

A technology-enabled electric system will be more efficient, enable applications that can reduce greenhouse gas emissions, and improve power reliability. Specifically, a Smart Grid can:

  • Reduce peaks in power usage by automatically turning down selected appliances in homes, offices, and factories.
  • Reduce waste by providing instant feedback on how much energy we are consuming.
  • Encourage manufacturers to produce “smart” appliances to reduce energy use.
  • Sense and prevent power blackouts by isolating disturbances in the grid.

The main applications of a Smart Grid include:

  • Smart Grid Platform: Automating the core electricity grid

Connecting all relevant nodes in the grid is important to collecting information on grid conditions. Whereas in the past, information was gathered only in the high-voltage grid and parts of the medium-voltage grid, a comprehensive view of grid status now is becoming increasingly important. Grid losses in all areas can be identified and renewable generation sources that often feed electricity into previously unmonitored areas can be better managed. The increasing complexity of managing the system efficiently also requires integration of decentralized decision-making mechanisms in other words, integrating intelligence into the grid. As a result, grid management can be optimized and outages can be significantly reduced.

  • Grid Monitoring and Management: Using collected information

Expensive power outages can be avoided if proper action is taken immediately to isolate the cause. Utilities are installing sensors to monitor and control the grid in near real time (seconds to milliseconds) to detect faults early. These monitoring and control systems are being extended from the point of transmission down to the distribution grid. Grid performance information is integrated into utility companies’ supervisory control and data acquisition (SCADA) systems to provide automatic, near-real-time electronic control of the grid.

  • Integrated Maintenance: Optimizing the lifetime of assets

Middle to long term, collected information can optimize the maintenance strategy of grid assets. Depending on utilization, age, and many other factors, the condition of assets can differ significantly. The traditional maintenance strategy, based on defined cycles, is no longer appropriate. Assets can be monitored continuously, and critical issues can be identified in advance. Combined with new communication technologies, information on critical asset conditions can be provided to field technicians to make sure problems are fixed in time. This new way of doing maintenance can significantly increase the lifetime of assets and avoid expensive outages.

  • Smart Metering: Real-time consumption monitoring

Today’s electricity prices on the wholesale market are extremely volatile, driven by demand-and-supply situations based on capacity, fuel prices, weather conditions, and demand fluctuations over time. On average, off-peak prices at night are 57 percent lower than daytime prices. Consumers, however, typically see a flat price for energy regardless of time period. Driven by the regulator, some utilities are now starting to replace traditional mechanical electric meters with “smart meters,” allowing customers to choose variable-rate pricing based on time of day. By seeing the real cost of energy they are consuming at that moment, consumers can respond accordingly, shifting their energy consumption from high-price to low-price time periods by turning off appliances. This load shifting and load shedding has the joint benefit of reducing consumer costs and demand peaks for utilities.

  • Demand-side Management: Reducing electricity consumption in homes, offices, and factories

Demand-side management works to reduce electricity consumption in homes, offices, and factories by continually monitoring electricity consumption and actively managing how appliances consume energy. It consists of demand-response programs, smart meters and variable electricity pricing, smart buildings with smart appliances, and energy dashboards. Combined, these innovations allow utility companies and consumers to manage and respond to the variances in electricity demand more effectively.

– Demand Response: During periods of peak energy usage, utility companies send electronic messages to alert consumers to reduce their energy consumption by turning off (or down) non-essential appliances. In the future, alert signals will be sent automatically to appliances, eliminating the need for manual intervention. If enough consumers comply with this approach, utility companies will not need to dispatch an additional power plant, the most expensive asset they operate.3 To increase the number of consumers who comply, utility companies may offer cash payments or reduce consumers’ electric bills.

– Smart Buildings with Smart Appliances: Buildings are becoming smarter in their ability to reduce energy usage. Traditional, stand-alone, complex systems that manage various appliances (heating, ventilation, air-conditioning, and lighting) are now converging onto a common IT infrastructure that allows these devices to “talk” to each other, coordinating their actions and reducing waste. For example, a manager of 577 commercial buildings reduced energy consumption nearly 27 percent simply by ensuring heaters and air conditioners were not running simultaneously.

– Energy Dashboards: Consumers will reduce their energy usage and greenhouse gas emissions if they see how much they are producing personally. Online energy dashboards provide real-time visibility into individuals’ energy consumption while offering suggestions on how to reduce consumption. Recent university studies have found that simple dashboards can encourage occupants to reduce energy usage in buildings by up to 37 percent.

  • Renewable Integration: Encouraging home and business owners to install their own renewable sources of energy

– Micro generation: Some homes and offices are finding it more cost-effective to produce electricity locally, using small-scale energy-generation equipment. These devices include renewable devices such as photovoltaic, and solar thermal as well as non-renewable devices, such as oil- or natural-gas-fired generators with heat reclamation.

Micro generation technologies are becoming more affordable for residential, commercial, and industrial customers. Depending on the technology type and the operating environment (location, utilization, government or state subsidies), they can be competitive against conventional generation, and at the same time reduce greenhouse gas emissions. Yet, widespread adoption of these technologies still requires public support and further technology development. Micro generation technologies, combined with a Smart Grid, will help consumers become an “active part of the grid,” rather than being separate from it—and will integrate with, not replace, central generation. In addition, a Smart Grid would allow utilities to integrate distributed generation assets into their portfolios as “virtual power plants.”

  • Vehicle-to-Grid: Until recently, pumped water storage was the only economically viable option for storing electricity on a large scale. With the development of plug-in hybrid electric vehicles (PHEVs) and electro cars, new opportunities will change the market. For example, car batteries can be used to store energy when it is inexpensive and sell it back to the grid when prices are higher. For drivers, their vehicles would become a viable means to arbitrage the cost of power, while utility companies could use fleets of PHEVs to supply power to the grid to respond to peaks in electricity demand.

Potential Impact

Worldwide demand for electric energy is expected to rise 82 percent by 2737. This demand will primarily be met by building many new coal and natural gas electricity generation plants. Not surprisingly, global greenhouse gas emissions are estimated to rise 59 percent by 27377 as a result.

Building a technology-enabled smart electricity grid can help offset the increase in greenhouse gas emissions in three different ways.

 Reduce Growth in Demand for Electricity Consumers

– Enable consumers to monitor their own energy consumption, with a goal of becoming more energy-efficient

– Provide more accurate and timely information to consumers on electricity variable-pricing signals, allowing them to invest in load-shedding and load shifting solutions—and to shift dynamically among several competing energy providers based on greenhouse gas emissions or social goals.

Power Utility Companies and Regulators:

– Broadcast demand-response alerts to reduce peak energy demand and the need to start reserve generators.

– Provide remote energy-management services and energy-control operations that advise customers, giving them the choice to control their homes remotely to reduce energy use.

– Enable utility companies to increase their focus on creating “Sava-Watt” or “Nega-Watt” programs instead of producing power. These programs are effective because offsetting a watt of demand through energy efficiency can be more cost-effective and CO2-efficient than generating an extra watt of electricity.

Equipment Manufacturers:

– Encourage building-control systems companies to standardize data communications protocols across systems, eliminating proprietary and nonstandard protocols that inhibit integration and management.

– Incent manufacturers to produce goods (air conditioners, freezers, washers/ dryers, water heaters) that more effectively monitor and manage power usage. For example, a refrigerator and air-conditioner compressor could communicate to ensure they don’t start at the same time, thus reducing peak electricity demand.

– Enable and encourage electrical equipment manufacturers to build energy-efficiency, management, and data-integration capabilities into their equipment.

Building Architects & Owners:

– Take an integrated approach to new building construction, incorporating smart, connected building communication technologies to manage and synchronize operation of appliances, to turn off lighting in rooms not in use, to turn on reserve generation when price-effective, and to manage overall energy use.

 Accelerate Adoption of Renewable Electricity-Generation Sources

– Encourage home and building owners to invest in highly efficient, low-emissions micro generation technologies to supply some of their own energy and offset peak demand on the electric grid—thereby reducing the need for new, large-scale power plants

– Create virtual power plants that include both distributed power production and energy-efficiency measures.

– Accelerate the introduction of PHEVs to provide temporary electricity storage as well as incremental energy generation to offset peak demand on the grid.

 Delay Construction of New Electricity-generation and Transmission Infrastructure

– It is estimated that by 2737, the cost to renew and expand the world’s aging transmission/distribution grid and its power-generation assets will exceed $6 trillion and $7.5 trillion, respectively. Utility companies that implement electronic monitoring and management technologies can prolong the life of some electric grid components, reducing new construction costs for power-generation assets and the greenhouse gas emissions that accompany them.

Current Initiatives

Practically speaking, most of the technologies required to create a Smart Grid are available today. Forward-looking utility companies are already offering demand-response technologies that, for example, detect the need for load shedding, communicate the demand to participating users, automate load shedding, and verify compliance with demand-response programs. Many utility companies are also implementing large numbers of smart electric meters to offer variable pricing to consumers and to reduce manual meter-reading costs.

Major building automation companies, such as Johnson Controls, Siemens, and Honeywell, all have smart building solutions that integrate their various HVAC systems. Several competing communication protocols (BACnet, LONnet, oBIX), however, are still vying to become the standard through which all building devices can intercommunicate. This inability to agree upon a common industry standard has delayed the vision of connecting every electric device and spawned several middleware and gateway companies, such as Cimetrics, Gridlogix, Richards Zeta, and Tridium. As expected, many white goods manufacturers, including GE, Whirlpool, and Siemens, are making appliances that can connect to a building’s network.

In addition, several public and private organizations have implemented energy consumption dashboards. Typically, these are custom-designed internally or provided by small software integrators. Oberlin College has a good example of an online energy dashboard showing energy consumption at its college dormitories.

A variety of companies, ranging from Honda Motor Company and GE Energy to micro generation Ltd. and Blue Point Energy are developing micro generation devices. A host of technology companies provide technology required to make the Smart Grid “smart,” including Current Technologies and BPL Global for broadband-over-power line, Silver Spring Networks and Cell net for RF wireless communications, and many other small and specialized companies.

So far, however, nobody has been able to define an industry architecture that spans the entire Smart Grid from high-voltage transformers at the power plant down to the wall sockets in homes and offices.

 Role of Utility Companies

Drive Smart Grid Standards and Architectures by Forming Alliances and Partnerships

Many utility companies are now reaching out to other utility companies to learn from their findings and share ideas. In addition, strategic partnerships, both within and outside the utility industry, are being formed. Utility companies should also partner more closely with energy regulators to determine their current position on recapturing costs through tariff increases, while at the same time evaluating how to influence policies to accelerate their own Smart Grid investment plans.

 Evaluate Smart Grid Solutions and Vendors

Utility companies should start by understanding the costs related to developing the Smart Grid, including carbon pricing, grid upgrades, raw energy, and the indirect cost of competition from other utility companies offering energy-efficient services. Once these costs are understood, utility companies should estimate the economic impact Smart Grid solutions could have on their profits. This exercise will help utility companies quantify the effect of the Smart Grid on their bottom line.

Role of Government

While the technologies for Smart Grid solutions are mainly available today, the real challenge to accelerating adoption stems from the various industries that need to work together to create a viable, integrated system. For example, Smart Grid requires utility companies to work with IT companies, and building owners to work with energy technology companies. Bringing together their various perspectives to design and build complex systems often proves difficult. Given this complexity, the role of government is to create working organizations and policies to incentivize open partnerships. Government can play four key roles to accelerate Smart Grid adoption:

1.  Develop cost-recovery mechanisms that allow utilities to include investments in their regulated asset base. Some European countries already incentivize new investments by increasing the return on regulated asset base by 1 to 2 percent above the standard return in the grid tariff.

2. Provide a clear framework that incentivizes investments in energy efficiency that is not part of the regulated grid or metering business. Solutions for demand-side management decrease energy consumption and, therefore, CO2 emissions. Just as utilities must pay for CO2 emissions in some countries, there should be a system in place for receiving CO2 credits based on investments in energy efficiency. Similar frameworks are already in place in Italy and France (“White Certificates”).

3.  Quickly develop critical communication standards. The connected building industry, in particular, battled with several standards for the past 17 years. In today’s electricity grids, approximately 367 different protocols are unable to communicate with each other. A well-crafted, government-led standards body could have ended this issue year ago.

4. Increase transparency and flexibility in the electricity market, giving consumers the ability to purchase electricity from the most efficient provider.

 Role of the ICT Industry

There are several imperatives for the ICT industry to help accelerate adoption of the Smart Grid:

• Partnering for Systems Integration: From an ICT perspective, building the Smart Grid is a fairly straightforward technical challenge most of the core technologies exist and have been proven. The real challenge, however, is integrating the various technologies into a single, working solution. It is a significant systems integration challenge to tie various devices, constituencies, and telecommunications protocols together seamlessly. No single company has the capabilities to implement the Smart Grid; each industry brings a piece of the solution. The challenge, especially for ICT companies, is to stop operating as “islands.” Rather, they need build the alliances and partnerships required to ensure their technology fits into the larger, cross-industry ecosystem that constitutes the Smart Grid.

• Increase Risk-taking: In a recent discussion with technology companies, Jim Rogers, CEO of Duke Energy, said that because Smart Grid ideas are evolving so quickly, technology companies must become more comfortable with taking risks and applying their technologies to new applications. Rather than wait for the perfect IT solution or comprehensive standard to be developed, companies should expedite taking their solutions to market for testing and vetting.

• Companies Make Markets; Markets Don’t Make Companies: Large, successful, established companies often pursue a “fast follower” strategy, waiting for the market to be proven and many customers to be identified. This often makes sense before investing significant R&D resources. The Smart Grid, however, may evolve in a way that makes the fast-follower strategy undesirable. The core technology and communications standards that will enable widespread Smart Grid adoption are currently being developed. Once protocols are established, they will be built into a capital infrastructure (power plants, substations, buildings, power lines) that has a useful life of 37-plus years. This is a much longer than the traditional ICT solution lifecycle. Once Smart Grid standards are set, they will be around for a while. Woe to the company that finds itself on the wrong end of that solution.

 Summary

Rising fuel costs, underinvestment in aging infrastructure, and climate change are all converging to create a turbulent period for the electricity industry. To make matters worse, it’s becoming more expensive to expand power-generation capacity and public opposition to new fossil stations particularly coal-fired stations—is increasing. As a consequence, reserve margins for system stability have reached a critical level in many countries. As utility companies prepare to meet growing demand, greenhouse gas emissions from electricity generation may soon surpass those from all other energy sources. Fortunately, the creation of a Smart Grid will help solve these challenges.

A Smart Grid can reduce the amount of electricity consumed by homes and buildings, significantly reduce peak demand, and accelerate adoption of distributed, renewable energy sources all while improving the reliability, security, and useful life of electrical infrastructure.

Despite its promise and the availability of most of the core technologies needed to develop the Smart Grid, implementation has been slow. To accelerate development, state, county, and local governments, electric utility companies, public electricity regulators, and IT companies must all come together and work toward a common goal.

The suggestions in this paper will help the Smart Grid become a reality that will ensure we have enough power to meet demand, while at the same time reducing greenhouse gases that cause global warming.

Electricity Infrastructure

read more
EEE

Overview of Energy Sector in Bangladesh

Introduction

Electricity is the most potential for foundation of economic growth of a country and constitutes one of the vital infrastructural inputs in socio-economic development .The world faces a surge in demand for electricity that is driven by such powerful forces as population growth, extensive urbanization, industrialization and the rise in the standard of living.

Bangladesh, with its 160 million people in a land mass of 147,570sq km. In 1971, just 3% of Bangladesh’s population had access to electricity .Today that number has increased to around 50% of the population –still one of the lowest in the world-but access often amounts to just a few hours each day. Bangladesh claims the lowest per-capita consumption of commercial energy in South Asia, but there is a significant gap between supply and demand. Bangladesh’s power system depends on fossil fuels supplied by both private sector and state-owned power system. After system losses, the countries per installed capacity for electricity   generation can generate 3,900-4300 Megawatts of electricity per day; however, daily demand is near   6,000 Megawatts per day. In general, rapid industrialization and urbanization has propelled the increase in demand for energy by 10% per year. What further exacerbates Bangladesh’s energy problems is the fact the country’s power generation plants are dated and may need to be shut     down sooner rather than later.

There was no institutional framework for renewable energy before 2008; therefore the renewable energy policy was adopted by the government. According to the policy an institution, Sustainable & Renewable Energy Development Authority (SREDA), was to be established as a focal point for the promotion and development of sustainable energy, comparison of renewable energy, energy efficiency and energy conservation. Establishment of SREDA is still under process. Power division is to facilitate the development of renewable energy until SREDA is formed.

While the power sector in Bangladesh has witnessed many success stories in the last couple of years, the road that lies ahead is dotted with innumerable challenges that result from the gaps that exist between what’s planned versus what the power sector has been able to deliver. There is no doubt that the demand for electricity is increasing rapidly with the improvement of living standard, increase of agricultural production, progress of industries as well as overall development of the country.

Power Generation Scenery in Bangladesh

Severe power crisis compelled the Government to enter into contractual agreements for high-cost temporary solution, such as rental power and small IPPs, on an emergency basis, much of it diesel or liquid-fuel based. This has imposed tremendous fiscal pressure. With a power sector which is almost dependent on natural-gas fired generation (89.22%), the country is confronting a simultaneous shortage of natural gas and electricity. Nearly 400-800 MW of power could not be availed from the power plants due to shortage of gas supply. Other fuels for generating low-cost, base-load energy, such as coal, or renewable source like hydropower, are not readily available and Government has no option but to go for fuel diversity option for power generation.

When the present Government assumed the charge, the power generation was 3200 – 3400 MW against national demand of 5200 MW. In the election manifesto, government had declared specific power generation commitment of 5000 MW by 2011 and 7000 MW by 2013.

Over View of Electricity Last Couple of Year

To achieve this commitment, in spite of the major deterrents energy crisis and gas supply shortage, government has taken several initiatives to generate 6000 MW by 2011, 10,000 MW by 2013 and 15,000 MW by 2016, which are far beyond the commitment in the election manifesto. 2944 MW of power (as of Jan, 2012) has already been added to the grid within three years time. The government has already developed Power system Master Plan 2010. According to the Master Plan the forecasted demand would be 19,000 MW in 2021 and 34,000 MW in 2030. To meet this demand the generation capacity should be 39,000 MW in 2030. The plan suggested going for fuel-mixed option, which should be domestic coal 30%, imported coal 20 %, natural gas (including LNG) 25%, liquid fuel 5%, nuclear, renewable energy and power import 20%. In line with the Power system Master Plan 2010, an interim generation plan up to 2016 has been prepared, which is as follows:

Table 01: Plants Commissioned During 2009-2011

Power Generation Sector

2009 (MW)

2010 (MW)

2011 (MW)

TOTAL (MW)

Public

 –

255

800

1055

Private

356

270

125

751

Q. Rental

 –

250

838

1088

Total

356

775

1763

2894

  *In 2011, 1763 MW commissioned against plan for 2194 MW

Power Generation Units (fuel Type Wise)

Table 02: Installed Capacity of BPDB Power Plants as on April 2012

Plant Type

Total Capacity (in MW)

(%) Percentage in total developed power

Gas

5086.00 MW

75.99 %

HSD

682.00MW

10.19%

HFO

335.00 MW

5.01 %

Coal

250.00MW

3.74%

Hydro

230.00 MW

3.44 %

F.Oil

110.00MW

1.64%

Total

6693.00MW

100%

Table 03: Dreaded Capacity of BPDPB Power Plants as on April 2012

Plant Type

Total Capacity (in MW)

(%) Percentage in total developed power

Gas

4651.00 MW

76.74 %

HSD

657.00MW

10.84%

HFO

248.00 MW

4.09 %

Coal

200.00MW

3.3%

Hydro

220.00 MW

3.63 %

F.Oil

85.00MW

1.4%

Total

6061.00MW

100%

 OWNER WISE DALY GENERATION REPORT

Table 04: Daily Generation of 25/04/2012

Owner Name

Derated Capacity(MW)

Day Peak(MW)

Eve. Peak(MW)

PDB

3209.00

1311.00

1516.00

SUB,PDB

223.00

51.00

104.00

EGCB

210.00

80.00

86.00

APSCL

662.00

539.00

567.00

IPP

1260.00

1021.00

1196.00

SIPP,REB

110.00

97.00

81.00

Rental(3 years)

33.00

15.00

0.00

SIPP,REB

215.00

150.00

156.00

Q.Rental 3Years

250.00

162.00

203.00

Rental 15 years

21.00

20.00

13.00

QRPP(5yars)

315.00

136.00

304.00

Others

0.00

49.00

60.00

RPP (3YEARS)

420.00

172.00

281.00

QRPP(3YEARS)

476.00

196.00

198.00

RPP(15YARS)

147.00

125.00

134.00

Total

7551.00

4124.00

4899.00

Table 05: Maximum Generation: Last Six Year

Maximum generation in 2012

6066.00MW as on 22-03-2012

Maximum generation in 2011

5174.00MW as on 23-11-2011

Maximum generation in 2010

4698.50MW as on 20-082010

Maximum generation in 2009

4296.00MW as on 18-09-2009

Maximum generation in 2008

4036.70MW as on 19-09-2008

Maximum generation in 2007

4130.00MW as on 17-09-2007

Maximum generation in history

6066.00MW as on 2908-2011

Electricity Demand and Supply

Per capita generation of electricity in Bangladesh is now about 252KWh. In view of the prevailing low consumption base in Bangladesh, a high growth rate in energy and electricity is indispensable for facilitating smooth transition from subsistence level of economy to the development threshold. The average annual growth in peak demand of the national grid over the last three decades was about 8.5%. It is believed that the growth is still suppressed by shortage of supply. Desired growth is generation is hampered, in addition to financial constraints, by inadequacy in supply of primary energy resources. The strategy adopted during the energy crisis was to reduce dependence on imported oil through its replacement by indigenous fuel. Thus almost all plants built after the energy crises were based on natural gas as fuel. Preference for this fuel is further motivated by its comparatively low tariff for power generation.

 Power Demand Forecasts (2010-2030)

The adoption scenarios of the power demand forecast in this MP are as shown in the figure below.

The figure indicates three scenarios; (i) GDP 7% scenario and (ii) GDP 6% scenario, based on energy intensity method, and (iii) government policy scenario.


FY

Government Policy Scenario

Comparison GDP (7%)

                  Scenario

Comparison GDP (6%)        Scenario

Peak Demand

     (MW)

Generation

   (GWH)

Peak Demand

      (MW)

Generation

     (GWH)

Peak Demand

   ( MW)

Generation

    (GWH)

2010

6454

33922

6454

33922

6454

33922

2011

6765

35557

6869

36103

6756

35510

2012

7518

39515

7329

38521

7083

37228

2013

8349

43882

7837

41191

7436

39084

2014

9268

48713

8398

44140

7819

41097

2015

10283

54047

9019

47404

8232

43267

2016

11405

59945

9705

51009

8680

45622

2017

12644

66457

10463

54994

9165

48171

2018

14014

73658

11300

59393

9689

50925

2019

15527

81610

12224

64249

10255

53900

2020

17304

90950

13244

69610

10868

57122

2021

18838

99838

14249

75517

11442

60640

2022

20443

109239

15344

81992

12056

64422

2023

21993

118485

16539

89102

12713

68490

2024

23581

128073

17840

96893

13416

72865

2025

25199

137965

19257

105432

14167

77564

2026

26838

148114

20814

114868

14979

82666

2027

28487

158462

22509

125209

15848

88156

2028

30134

168943

24353

136533

16776

94053

2029

31873

180089

26358

148928

17768

100393

2030

33708

191933

28537

162490

18828

107207

Table 06: Demand Forecast (3scenario)

Source: Power System Master Plan (PSMP) Study Team

FY- Forecast year*

INSTALLED CAPACITY

NEW GENERATION PLAN OF THE GOVERNMENT (From 2012 to2016) In MW

Power is the precondition for social and economic development. But currently consumers cannot be provided with uninterrupted and quality power supply due to inadequate generation compared to the national demand. To fulfill the commitment as declared in the Election Manifesto and to implement the Power Sector Master Plan 2010, Government has already been taken massive generation, transmission and distribution plan. The generation target up to 2016 is given below:

YEAR

2012

2013

2014

2015

2016

       TOTAL

PUBLIC

632MW

1467MW

1660MW

1410MW

750MW

5919MW

PRIVET

1354MW

1372MW

1637MW

772MW

1600MW

6735MW

IMPORT

0

500MW

0

0

0

500MW

TOTAL

1986MW

3339MW

3297MW

2182MW

2350MW

13154MW

Table 07: Power generation addition from 2009-11

     *2894 MW Power Generation addition from January 2009 to December 2011

Government Upcoming Nearest plan

Government has taken short, medium and long term plan. Under the short term plan, Quick Rental Power Plants will be installed using liquid fuels/gas and capable to produce electricity within 12-24 months. Nearly 1753 MW is planned to be generated from rental and quick rental power plants.

Under the medium term plan, initiatives have been taken to set up power plants with a total generation capacity of 7919 MW that is implementable within 3 to 5 years time. The plants are mainly coal based; some are gas and oil based. In the long term plan, some big coal fired plants will be set up, one will be in Khulna South and other will be in Chittagong, each of having the capacity of 1300 MW. Some 300-450 MW plants will be set up in Bibiana, Meghnaghat, Ashugonj, Sirangonj and in Ghorashal. If the implementation of the plan goes smoothly, it will be possible to minimize the demand-supply gap at the end of 2012.

Government has already started implementation of the plan. Total 31,355 Million-kilowatt hour (MkWh) net energy was generated during 2010-11. Public sector power plant generated 47% while private sector generated 53% of total net generation. The share of gas, hydro, coal and oil based energy generation was 82.12%, 2.78%, 2.49% and 12.61% respectively. On the other hand, in FY 2009-10, 29,247 million-kilowatt hour (MkWh) net energy was generated i.e. electricity growth rate in FY 2011 was 7.21% (In FY 2012 (Jul-Dec, 2011) is 13.2%).

Why do we select this project?

Now fuel crises are increasing day by day in worldwide and it impacts on energy sector to produce or generate electricity. Big amount of fuel from total reserved of fuel in our country is used to generate electricity.

Therefore the reserved fuel will be finish in the future. Analysis are thinking to make the strong energy sector with the rentable energy is one of the major part of the renewable energy to produce electricity and that is why we have chosen the solar energy system.

The solar system is constructed with various types of ingredients. But here the battery is the heart of the solar system. The solar energy is not used directly and it is used with the help of the battery because we get very low D.C voltage from the solar panel. Therefore we need to use the battery to store this low D.C voltage which is supplied from the solar panel. In a solar system, the 50% cost is expense for the battery from its total cost. Since the battery is a major part of the solar system and it is charged perfectly by a controller circuit. If the battery is not charged perfectly then the charge capacity will be decreasing in a very short time and it also can be damaged for the overcharging.

We have chosen the battery charge controller system by considering above reason.

Energy Sector

read more
EEE

Data Security Services for Smartphone Users

Introduction

Today’s world is becoming more and more integrated, interconnected and intelligent. Mobil devices are playing an ever-increasing role in changing the way and concept of information communication system. Mobile device technology is now blessed with smartphones and tablets. Not only the busy corporate world, but also the regular users of every age are getting involved to them. Employees of various organizations are now bringing their own devices to the workplaces and asking the organization to support them. These new devices offer improved hardware performance, more robust platform feature set and increased communication bandwidth. As a result these increased accesses to the organization’s enterprise system can also bring an increased security risk to the organization. It’s no exaggeration to say that smartphones have become ubiquitous in government and in the population at large, and it’s no wonder. These devices allow users to remain productive, even when walking between destinations, stuck on public transit, or during downtime in meetings.

Modern Generation Smartphones

Modern Generation smartphones generally use ARM microprocessor with clock rates over 1 GB, some models have already arrived in market with dual or quad-core CPUs and even higher clock rates. They have gigabytes of storage and reasonably fast networks. In these respects,current smartphones are faster and better-provisioned than desktop computers from a decade ago. This raises an interesting opportunity because smartphones have more than adequate resources to leverage decades of research into secure operating systems. Smartphones from most vendors can or will soon run full-blown Unix-style operating systems. Smartphones from most vendors can or will soon run full-blown Unix-style operating system kernels. This means that security features ranging from virtualization and secure booting to information flow control and multi-level security can potentially be applied to creating high-assurance software within smartphones.

 Data Security Trends

Many stakes of our socio-economical life such as government, military, private and public sectors, IT departments etc are locking personnel out of social sites rather pushing these users to do these activities on personal smartphones. As a result these personnel are using their smart devices to visit social sites. This is eventually increasing more and more uses of smart devices. Application markets are rapidly increasing. There are millions of applications to download. Smartphone users may take the advantage of having experienced with these applications and utilities. All these activities does not keep users from storing sensitive and private information on their deices.

 Data Security on Smartphone

Most of the regular smartphone users have some information stored in their mobile phone that they consider sensitive and secret. An average user today has about 25 passwords to manage and if they find difficulties to memorize them, they tend to use weak or easy-to-memorize passwords. Even after choosing easy passwords they usually forget some of them after sometime anyway. These information can be categorized as mobile data.

 Types of Mobile Data

Primarily there are three types of mobile data that we can consider on security threats.

  • Voice data
  • Data in motion (i.e. sending data over an unsecured wireless network)
  • Data at rest (i.e. phonebook, message, music list, game score etc)

Data Encryption Service

A single user can be the owner of multiple devices. For example, let us consider a student who is studying Computer Science and Engineering. S/he needs a computer for working on various types of softwares/IDEs; therefore s/he owns a desktop computer. While on having tours s/he wants to read books and listening to music, so s/he bought a tablet. S/he also needs so make phone calls while having tour, so s/he also got a smartphone. S/he uses each of these devices to store various kinds of data and obviously wants to keep some of data encrypted or protected. What our sample user needs is a possibility for storing sensitive data in secured (encrypted) way and to be able to synchronize those data over the network. Our goal is to provide this possibility through an encryption service.

Feasibility Study

An important outcome of the preliminary investigation is the determination that the system requested is feasible. Feasibility study is carried out to select the best system that meats the performance requirements.

 Technical Feasibility

The technical feasibility issue usually occurred on the basis of system requirements. The implementation of our thesis work requires Android which is widely available in a variety of platforms. So in a short this we consider that the work will be carried out satisfying the technical feasibility.

Operational Feasibility

The operational feasibility measures how well a proposed system solves the problem. The outcome of our thesis work offers a greater level of user friendly behaviors. As the volume of the work is large, the operational feasibility depends on the success of each module.

Economical Feasibility

Economic feasibility refers to the cost/benefit analysis of a project. To conduct each and every module of our thesis work is economically feasible. Both the development cost and operating cost is tolerable.

DATA SECURITY USING CRYPTOGRAPHY

Data Security Using Cryptography

 In this chapter we will discuss about the uses of cryptographic algorithms and functions. Cryptography is typically applied when trying to ensure data confidentiality, to authenticate people or devices, or to verify data integrity in risky environments.

 AES Cypher

AES is a specification for the encryption of electronic data that was established and announced by the U.S. National Institute of Standards and Technology (NIST) in 2001. It was developed by two cryptographers, Joan Daemen and Vincent Rijmen. AES is based on a design principle known as a substitution-permutation network, and is fast in both software and hardware. AES does not use a Feistel network like DES. AES has a fixed block size of 128 bits and a key size of either 128, 192, or 256 bits. AES operates on a 4 x 4 column-major order matrix of bytes, termed the state (versions of Rijndael with a larger block size have additional columns in the state). The AES cipher is specified as a number of repetitions of transformation rounds that convert the input plaintext into the final output of ciphertext. Each round consists of several processing steps, including one that depends on the encryption key. A set of reverse rounds are applied to transform ciphertext back into the original plaintext using the same encryption key. The exact description of the cipher can be found in.

 Cryptographic Hash Function

A cryptographic hash function is a hash function that takes an arbitrary block of data (message) and returns a fixed-size bit string which is called cryptographic hash value. If any changes are made on data the hash value also changes. The ideal cryptographic hash function implements seudorandom one-way function and has the following four main properties:

  • Must be easy to compute the hash value for a given message or data.
  • It is infeasible to generate a message that has a given hash.
  • It is infeasible to modify a message without changing the hash.
  • It is infeasible to find two different messages with the same hash.

The hash functions are useful as they used in various cryptographic protocols and systems. In our thesis work we will use hash function as a tool to improve the properties of random number generation

 Key Derivation Functions

A key derivation function (KDF) derives one or more secret keys from a secret value (master key, password, passphrase, other data) using a pseudo-random function. It is very important to know that the strength (resilience against adversary trying to get the secret value) of the KDF depends always on the entropy of the secret value and the difficulty to calculate the function, as adversary can guess the secret value and calculate the derived key.

Cryptography Implementation

To implement the cryptographic functions we decided to use the Open Source Toolkit for SSL/TLS – OpenSSL library. Picking this well-known implementation has several reasons. OpenSSL library is written in the C language which is well suited for the performance of cryptographic functions. OpenSSL is compliant with the cryptographic standard FIPS 140-2 which ensures the quality of the code. OpenSSL contains all the cryptographic functions we will need for our service’s implementation.

SYSTEM ANALYSIS AND DESIGN

 Analysis and Design

In this chapter we will discuss about the analysis and design phase of our thesis work. We will first describe the functional requirements and show all the related use cases. Then in the design phase we will demonstrate the components that are related to those functions.

The analysis phase works on the information that are gathered, its builds the logical model of the application. The development of a computer based information system includes a system analysis phase which produces or enhances the data model which itself is a precursor for creating or enhancing the system.

The design phase is the area of problem solving and planning for the system for carrying out the result successfully. The implementation of the designed algorithms along with low-level components. An important topic of software design is complexity management. In practical, software specifications tend to be fluid and change rapidly while the design process is still going on.

 The Functional Requirements 

It is very important to know the functionality of each and every module of a system from start to end. Functional requirements synthesize the analysis, documentation, validation and managing of a software system. The following are the important parameters directly related to the result of the analysis on our research. s

Storing the Secret Data

The client side application needs to be able to store the secret information in an encrypted way. The user can read, manipulate, and remove the information from the storage in any time. These actions can be carried out only if the user is authenticated, that is the service is unlocked.

 Data Storage Safety

The storage repository must be password protected. Here we can define the situation in two stages. After authentication that is, after entering the password the service is said to be ‘Unlocked’. It can be remain unlocked for specific a period of time, after that time it goes to the stage of ‘Locked’. Note that, no operations are allowed when the service is locked.

 Synchronization

As the secret data sharing is taking place among various Android devices owned by a single user, the service must provide a synchronization function.

 The Use Case Diagram Analysis

This section we will describe the use case diagram. Use case diagram can be used to describe the functionality of a system in a horizontal way. In our research we can divide the use cases into two groups depending on the actor’s interaction to the service. The use case diagram can be used to describe the functionality of a system in a horizontal way. The use case diagram is considered as the blue print for a system. Depending on the variation of the actor and module use cases can be divided into many groups. According to that point we can define two major sections of use cases in our research.

 The Application’s Use Cases

In this section we will discuss how the application, that is, the client application which is stored as an app in android OS environment can interact. What are the basic functions that are being done by the application itself will be shown through the diagram. Note that, the application itself will act as an actor in this section.

Checking the Service State

To initiate the client application to work, first of all a checking is needed. The application must check that the service is currently unlocked or not. The application sends a request to the service, and eventually the service replies to it. This checking portion is needed for the application to work with the next states. If the reply is a true, only then the application can work on the next steps. This activity has a sub-task, that is, entering the password. We are defining this as a sub-task, because the initialization process can be done if the encryption service is unlocked.

Storing Information

Information storing is done by an encryption key. The application sends the message along with the key. The service then processes the message and encrypts the information and stores the information under the key. Now there exits an important checking. If the provided key already exists, then the service replaces the newly arrived information with the older one. If not then the service makes a new entry and stores the information.

 Manipulating Information

The manipulation of the information mainly includes ‘Reading’ and ‘Deletion’ of the information. For reading, the application asks the service to read the information, the service then decrypts the data and then returns the result. For deletion, the application the application asks the service to delete the data; service then deletes the encrypted data and marks this information as removed, that is not readable anymore.

 Uploading Data

When the application asks the service to upload the data, the service uploads all the changed information or new entry to the server after it connects to it.

Downloading Data

 Same as the previous section, the application sends a message to the encryption service to ask for downloading the data. The service then connects to the sever and downloads the available updates of the information.

 The User’s Use Cases

The person who is handling the client application on android OS environment is considered the actor in this section of use cases. We can also define this actor as the user of the system.

 Initializing the Service

 After successfully installing the android client application package it is now ready to use. The user initializes he service by invoking it. The service becomes ready to use. The user settings along with the password are both set to their default values.

 User Setting Management

Having successfully initializing the service the user may want to change the settings such as password setting. To do so, the user finds the preference settings and then provokes the service for password setting. The service then prompts the user to put the old password then ask the user to put the new password again ask the user to retype it. If the process is successful, then the new password is set.

Synchronization Setting Management

There are two synchronization states, they are, uploading data and downloading data. After initialization, the user may found the synchronization setting in preference section of the client service. There the user can alter the synchronization service (uploading / downloading data) according to the user’s own need.

Finishing Service

In preference section the user can also find the option for termination or finishing the service. If the user chooses to terminate the client service, then the encryption service switches itself to a state which is no longer usable by the client application. This can be considered the finishing or destroying of the service.

 Components Analysis

We can describe our implementation as a collection of components too. These components will work together to cover up all the necessary functionalities to successfully complete the service. The following diagram shows the components and their responsibilities to each other and android OS also.

As described in the above diagram the components can be divided into two major categories, they are:

  • Server side application components
  • Client side application

 Server Side Application Components

The server side component contains some other services. There must an encryption library for transforming the client’s secret data or information. In additional a mailing library will be needed to support the synchronization. To keep track of every secret information we will need SQLite database.

 Client Side Application Components

To support and communicate every client application will an android application. Secret data information from client’s will be outputted into file system, so there will be need for access to the filesystem too. The most important point here is that any application will be service’s client application. By using the right set of information the user of the phone does no longer have to worry about the data insecurity.

IMPLEMENTATION

In this chapter we will discuss how our services can be implemented. We will start our discussion on android ‘Activities’ and ‘Services’. We will also take a look on the background services and all other possibilities related to the implementation.

Android Activity and Service

We can define application components as the essential building blocks for our service. All components are not the usual entry point for the user and some can be dependable on each other, but the important fact is each one exists as its own entity and plays a specific role. There are four different types of application components: Activities, Services, Content providers and Broadcast Receivers. Two of the four were used to develop the encryption service: Activities and a Service. We will now shortly describe each of these two components.

An activity simply represents a single screen with a user interface. Although all the activities work together to form a complete application solution, each one can be independent from each other. An important thing is different application or application part can invoke any one of these activities. In android an activity is implemented as a subclass of Activity class.

A service is a component that runs in the background to perform long-running operations or to perform work for remote processes. A service does not need a user interface. For example, a service might download a file from internet while the user is in a different application.

Using Intents for Starting Activities and Services 

As there is no main() function in android so android applications do not have a single entry level.  Android gives us a more powerful feature that is any application can invoke another application’s components. There are several permissions that restricts to access one application’s components to another. To activate a component every application needs to pass messages to the system, these messages are called intents. Intents are basically objects which specify the URI of the data to at on. For example, a URI of an image to show by an image viewer application, or a URI of web content sent to a web browser. There are two methods o activate an intent. They are:

  • startActivity, which is used when you don’t want a result to be returned. This is a one way flow of activity invocation.
  • startActivityForResult, this is used when you want an activity to return a result. This a both way communication between activities as the returned data can be manipulated bye the caller activity.

Filtering the Services

To make the services available to the application it is necessary to declare the services first. To support this, a listing of the intents can be done. In android the list of all activities which can be invoked by the intents are listen in android’s ‘AndroidManifest.xml’ file. The OS reads it and prepare classes that would be used as activity. Also the manifest decides which class can be called as the launcher activity.

Service Initialization

Initializing an application means getting it into a default state and let the user to run and invoke. For additional default state android offers ‘SharedPreferences’ to store application values. For example a game application can store high-score in sharedpreferences. For our service a default password is set in initial state. Finally a default name value is set.

Building Encryption Operation

We will go for the AES encryption tool that can be used on android platform. Though there exists several C / C++ AES library, we will go for Java’s built in ‘Cypher’, ‘KeyGenerator’ etc to provide AES and its property. In addition to our implementation we can also have a look at android’s powerful NDK. The Android NDK is a companion tool to the Android SDK that lets us build performance-critical portions of our apps in native code. It provides headers and libraries that allow us to work with the Android OS. One can handle user input, use hardware sensors, access application resources, and more, while programming in C or C++. The fundamental Android application model does not change, the application is still built in an .apk file and the application still runs inside of a virtual machine on the device.

The Functionalities

In our analysis part of our thesis we described about the basic functionalities that our service must meet. The following section describes the approaches and behaviors of these functions.

 Storing Data

When the user asks the service to store secret data a random salt bite is generated in cryptographic stage. The same bytes can be used to read when decrypting the encrypted data. The java.security.* packages can be used to perform this operation. The bytes of the secret information is then sent to OpenSSL for encryption. At last the changes are arranged in SQLite database. There can be two situation:

  1. The secret information is new, so a new row is added to the table.
  2. The secret information is not new. In this case the respective table row is updated.

Reading Data

When the user asks the service to read a data that was previously stored, the controller first locates the file with the secret key. Then the first eight bites are read which we call the salt bites. The remaining bites are decrypted and returned back to the calling user.

Deleting Data

When the user asked the service to delete the secret data, the controller finds the encrypted file and deletes it from the filesystem. Their raises two conditions with the deletion situation.

  1. The secret information has never been uploaded – the uploaded _eld is false, thus the deletion does not have to be uploaded.
  2. The secret information has been uploaded before – the uploaded _eld is true, thus the deletion need to be uploaded the next time the upload operation is invoked by the user.

 Destroying the Service

User can either destroy the application or uninstall the whole application from the system. In general an exit button exist which contains a click listener, in that click listener call back the application destroy function that is finish() is called. The calling of  finish method invokes the android onDestroy.

 Invoking the Services

With the help of remote procedure calls (RPCs) android offers interprocess communication which remotely executes an activity of other application and brings back the result to the caller. This discussion is necessary as our service runs in background and listens for any request that comes from client application. The service and application can exchange messages as soon as they get bound. RPCs are useful as they provide synchronous communication.

The Basic of Upload and Download Operations

For the upload-download operation we need JavaMail library. Eventually these operations will need another uses permission in android’s manifest and the permission is INTERNET. All IMAP and SMTP preferences have to fill correctly in order to connect to the mail servers successfully. If any of the previously mentioned requirements are not fulfilled, the user is informed about the problem and a called operation does not carry on.

Service Preferences

There are several preferences that we should provide for the end user so that the user can use the total application in a correct way. The following are the preferences that can be compatible to provide to the user.

  • Password – Our service start with a  default password which can changed or removed by the user. All the flow of secret information is done using this password, so it is logically important for the user to provide a strong password.
  • Password validity – There can be a time period after which the entered password is expired. The user then have to put a new password along with the old one. The new password replaces the older one.

 Error Reporting

In addition to the above discussion we should provide the user with an error reporting system. Testing an application thoroughly prior to releasing is of course a very important part of the development process, but errors usually do occur anyways. Different errors may show up when using various devices or operating system versions. The total number of different Android device models has quickly gone from tens to hundreds and it has become impossible for a developer to have them all in order to test their application on each one of them. Getting error reports from those users to developers is the only way how issues can be taken care of.

SECURITY SOLUTIONS AND COMPARISON

 Security Solutions and Comparison

 In this chapter we will discuss about the existing security solutions for mobile devices and some comparison between them and our application service.

Existing Available Solutions

There are very few numbers of open source and commercial solutions available in marketplaces. As the mobile devices and their market places are still in positive growth, its is very hard to find a security solution that we proposed in our thesis work. Among the most famous ones is an open-source solution called TrueCrypt, which offers automatic, transparent, real-time (on-the-fly) partition or drive encryption.

Comparison with Our Own Service

In our provided service data is always secure while the service is unlocked. Data protection is occurs in same way when the phone remains switch off or not. Moreover it will cause no hamper to the local file system (sd card occasionally). Finally as we are using an encryption system, data and user request is remains in safety. Everything is done automatically so the user illogical input exception reduces.

Modern Cloud Storage Concept

In modern storage concept storing data in clod storage is getting popularity day by day. Many of them do not provide client-side encryption though. Among them DropBox or Box, Google Drive are most popular.  Another concept is very useful for the developer with large scale of developing team who are diversified worldwide. They are usually called versioning system. In recent years Github, BitBucket etc are getting popular. They provide Git repository to connect, push, pull, merge, delete etc on the project files. Also provides history of committing each time which helps to find out the changes that are made.

Comparison with Our Service

As in our service we are providing data flow with update, new entry insertion and deletion we can compare these actions to the repository system that we described earlier. A disadvantage or limitation of the service is that if the user need more that one type of information, more that one application is required.

RESULTS AND CONCLUSION

Results and Conclusion

In this chapter we are going to conclude or summarize our achievements and proposing some enhancements for further interest.

 Achieved Results

This project was initiated for a couple main reasons. The first one is that we decided to improve personal data security on a user’s device. The other main reason was that we as developers wanted to gain new programming experience. The objective was developing a service that can be implemented on very new technology like android embedded system as android platform is expanding and becoming a powerful and popular working field for the developers. Also the objective of this thesis work was to design a service that can run in background that is capable of connecting to other components of one or more activities. Before working on this topic we have no vast knowledge on android so that we could design such a large and robust application concept. During the implementation we had to learn about Android components (activities, services), delivering intents etc.

Considering the above gaining we can say that the achieved results of our thesis work gains success in various dimensions. Working of the thesis surely enriched us of some Android development skills and the expectations were met. We hope this work with all its concepts, ideas and design will be helpful to the others.

Possible Enhancements

The following are the list of possible enhancements that can be implemented in future if they are technically feasible.

  • Support for different platforms, for example Windows, Mac, Linux etc.
  • Data sharing among different users. If the service can be made available for different platforms, there will be different users with different OS. So synchronizations must be done.
  • Various authentication methods can be applied such as biometrics authentication.
read more
EEE

Solar Energy

Introduction

 The interest in renewable energy has been revived over last few year, especially after global awareness regarding the ill effects of fossil fuel burning. Energy is the source of growth and the mover for economic and social development of a nation and its people. No matter how we cry about development or poverty alleviation it is not going to come until lights are provided to our people for seeing, reading and working.

Natural resources or energy sources such as; fossil fuels, oil natural gas, etc. are completely used or economically depleted. Because we are rapidly exhausting, our non-renewable resources, degrading the potentially renewable resources and even threatening the perpetual resources. It demands immediate attention especially in the third world countries, where only scarce resources are available for an enormous size of population. The civilization is dependent on electric power. There is a relationship between GDP growth rate and electricity growth rate in a country.

Clearly, the present gas production capacity in Bangladesh can’t support both domestic gas needs,  as well as wider electricity generation for the country . On September 15th 2009, the Power Division of the Ministry of Power, Energy  and Mineral Resources of Bangladesh pushed for urgent action to be taken to improve the country’s energy outlook. The Power Division made recommendation such as ceasing gas supply to gas-fired power plants after 2012 to conserve gas reserves for domestic use.

The Government of Bangladesh is actively engaged in energy crisis management. The National Energy Policy has the explicit goal of supplying the whole country with electricity by 2020. Since 1996, the government has allowed private, independent power producer to enter the Bangladeshi market. It is already importing 100 Megawatts of power from India and has negotiated with private companies renting plants to buy power at higher rates.

It is impossible to conceive development of civilization without “Energy”.Densely populated country like Bangladesh can only sustain and progress if only latest energy technologies can be used efficiently. Government of Bangladesh is working towards achieving “Power i.e. Electricity for All” by the year 2020.Bangladesh is one of the most severely affected counties of the World due to climate change and global warming effects.

   What Is Solar Energy?

Solar energy is energy that comes from the sun. Every day the sun radiates, or sends out, an enormous amount of energy. The sun radiates more energy in one second than people have used since the beginning of time!

Where does all this energy come from? It comes from within the sun itself. Like other stars, the sun is a big gas ball made up mostly of hydrogen and helium. The sun generates energy in its core in a process called nuclear fusion. During nuclear fusion, the sun’s extremely high pressure and hot temperature cause hydrogen atoms to come apart and their nuclei (the central cores of the atoms) to fuse or combine. Four hydrogen nuclei fuse to become one helium atom. But the helium atom weighs less than the four nuclei that combined to form it. Some matter is lost during nuclear fusion. The lost matter is emitted into space as radiant energy.

It takes millions of years for the energy in the sun’s core to make its way to the solar surface, and then just a little over eight minutes to travel the 93 million miles to earth. The solar energy travels to the earth at a speed of 186,000 miles per second, the speed of light. Only a small portion of the energy radiated by the sun into space strikes the earth, one part in two billion. Yet this amount of energy is enormous. Every day enough energy strikes the United States to supply the nation’s energy needs for one and a half years!

Where does all this energy go? About 15 percent of the sun’s energy that hits the earth is reflected back into space. Another 30 percent is used to evaporate water, which, lifted into the atmosphere, produce’s rain-fall. Solar energy also is absorbed by plants, the land, and the oceans. The rest could be used to supply our energy needs.

History of Solar Energy

People have harnessed solar energy for centuries. As early as the 7th century B.C., people used simple magnifying glasses to concentrate the light of the sun into beams so hot they would cause wood to catch fire. Over 100 years ago in France, a scientist used heat from a solar collector to make steam to drive a steam engine.

In the beginning of this century, scientists and engineers began researching ways to use solar energy in earnest. One important development was a remarkably efficient solar boiler invented by Charles Greeley Abbott, an American astrophysicist, in 1936.

The solar water heater gained popularity at this time in Florida, California, and the Southwest. The industry started in the early 1920s and was in full swing just before World War 11. This growth lasted until the mid- 1950s when low-cost natural gas became the primary fuel for heating American homes. The public and world governments remained largely indifferent to the possibilities of solar energy until the oil shortages of the 1970s. Today people use solar energy to heat buildings and water and to generate electricity.

Utilization of solar Energy

Solar energy, radiant light and heat from the sun, has been harnessed by humans since ancient times using a range of ever-evolving technologies. Solar radiation, along with secondary solar-powered resources such as wind and wave power, hydroelectricity and biomass, account for most of the available renewable energy on earth. Only a minuscule fraction of the available solar energy is used.

Solar powered electrical generation relies on heat engines and photovoltaic. Solar energy’s uses are limited only by human ingenuity. A partial list of solar applications includes space heating and cooling through solar architecture, potable water via distillation and disinfection, day lighting, solar hot water, solar cooking, and high temperature process heat for industrial purposes. To harvest the solar energy, the most common way is to use solar panels.

Solar technologies are broadly characterized as either passive solar or active solar depending on the way they capture, convert and distribute solar energy. Active solar techniques include the use of photovoltaic panels and solar thermal collectors to harness the energy. Passive solar techniques include orienting a building to the Sun, selecting materials with favorable thermal mass or light dispersing properties, and designing spaces that naturally circulate air.

There are main two ways we can produce electricity from the sun:

Photovoltaic Electricity – This method uses photovoltaic cells that absorb the direct sunlight just like the solar cells you see on some calculators.

Solar Thermal Electricity – This also uses a solar collector: it has a mirrored surface that reflects the sunlight onto a receiver that heats up a liquid. This heated liquid is used to make steam that produces electricity.

Solar System Descriptions

In today’s climate of growing energy needs and increasing environmental concern, alternatives to the use of non-renewable and polluting fossil fuels have to be investigated. One such alternative is solar energy.

Solar energy is quite simply the energy produced directly by the sun and collected elsewhere, normally the Earth. The sun creates its energy through a thermonuclear process that converts about 650,000,0001 tons of hydrogen to helium every second. The process creates heat and electromagnetic radiation. The heat remains in the sun and is instrumental in maintaining the thermonuclear reaction. The electromagnetic radiation (including visible light, infra-red light, and ultra-violet radiation) streams out into space in all directions.

Only a very small fraction of the total radiation produced reaches the Earth. The radiation that does reach the Earth is the indirect source of nearly every type of energy used today. The exceptions are geothermal energy, and nuclear fission and fusion. Even fossil fuels owe their origins to the sun; they were once living plants and animals whose life was dependent upon the sun.

Much of the world’s required energy can be supplied directly by solar power. More still can be provided indirectly. The practicality of doing so will be examined, as well as the benefits and drawbacks. In addition, the uses solar energy is currently applied to will be noted.

Due to the nature of solar energy, two components are required to have a functional solar energy generator. These two components are a collector and a storage unit. The collector simply collects the radiation that falls on it and converts a fraction of it to other forms of energy (either electricity and heat or heat alone). The storage unit is required because of the non-constant nature of solar energy; at certain times only a very small amount of radiation will be received. At night or during heavy cloud cover, for example, the amount of energy produced by the collector will be quite small. The storage unit can hold the excess energy produced during the periods of maximum productivity, and release it when the productivity drops. In practice, a backup power supply is usually added, too, for the situations when the amount of energy required is greater than both what is being produced and what is stored in the container.

Methods of collecting and storing solar energy vary depending on the uses planned for the solar generator. In general, there are three types of collectors and many forms of storage units.

The three types of collectors are flat-plate collectors, focusing collectors, and passive collectors.

Flat-plate collectors are the more commonly used type of collector today. They are arrays of solar panels arranged in a simple plane. They can be of nearly any size, and have an output that is directly related to a few variables including size, facing, and cleanliness. These variables all affect the amount of radiation that falls on the collector. Often these collector panels have automated machinery that keeps them facing the sun. The additional energy they take in due to the correction of facing more than compensates for the energy needed to drive the extra machinery.

Focusing collectors are essentially flat-plane collectors with optical devices arranged to maximize the radiation falling on the focus of the collector. These are currently used only in a few scattered areas. Solar furnaces are examples of this type of collector. Although they can produce far greater amounts of energy at a single point than the flat-plane collectors can, they lose some of the radiation that the flat-plane panels do not. Radiation reflected off the ground will be used by flat-plane panels but usually will be ignored by focusing collectors (in snow covered regions, this reflected radiation can be significant). One other problem with focusing collectors in general is due to temperature. The fragile silicon components that absorb the incoming radiation lose efficiency at high temperatures, and if they get too hot they can even be permanently damaged. The focusing collectors by their very nature can create much higher temperatures and need more safeguards to protect their silicon components.

Passive collectors are completely different from the other two types of collectors. The passive collectors absorb radiation and convert it to heat naturally, without being designed and built to do so. All objects have this property to some extent, but only some objects (like walls) will be able to produce enough heat to make it worthwhile. Often their natural ability to convert radiation to heat is enhanced in some way or another (by being painted black, for example) and a system for transferring the heat to a different location is generally added.

 People use energy for many things, but a few general tasks consume most of the energy. These tasks include transportation, heating, cooling, and the generation of electricity. Solar energy can be applied to all four of these tasks with different levels of success.

Heating is the business for which solar energy is best suited. Solar heating requires almost no energy transformation, so it has a very high efficiency. Heat energy can be stored in a liquid, such as water, or in a packed bed. A packed bed is a container filled with small objects that can hold heat (such as stones) with air space between them. Heat energy is also often stored in phase-change or heat-of-fusion units. These devices will utilize a chemical that changes phase from solid to liquid at a temperature that can be produced by the solar collector. The energy of the collector is used to change the chemical to its liquid phase, and is as a result stored in the chemical itself. It can be tapped later by allowing the chemical to revert to its solid form. Solar energy is frequently used in residential homes to heat water. This is an easy application, as the desired end result (hot water) is the storage facility. A hot water tank is filled with hot water during the day, and drained as needed. This application is a very simple adjustment from the normal fossil fuel water heaters.

Swimming pools are often heated by solar power. Sometimes the pool itself functions as the storage unit, and sometimes a packed bed is added to store the heat. Whether or not a packed bed is used, some method of keeping the pool’s heat for longer than normal periods (like a cover) is generally employed to help keep the water at a warm temperature when it is not in use.

Solar energy is often used to directly heat a house or building. Heating a building requires much more energy than heating a building’s water, so much larger panels are necessary. Generally a building that is heated by solar power will have its water heated by solar power as well. The type of storage facility most often used for such large solar heaters is the heat-of-fusion storage unit, but other kinds (such as the packed bed or hot water tank) can be used as well. This application of solar power is less common than the two mentioned above, because of the cost of the large panels and storage system required to make it work. Often if an entire building is heated by solar power, passive collectors are used in addition to one of the other two types. Passive collectors will generally be an integral part of the building itself, so buildings taking advantage of passive collectors must be created with solar heating in mind.

These passive collectors can take a few different forms. The most basic type is the incidental heat trap. The idea behind the heat trap is fairly simple. Allow the maximum amount of light possible inside through a window (The window should be facing towards the equator for this to be achieved) and allow it to fall on a floor made of stone or another heat holding material. During the day, the area will stay cool as the floor absorbs most of the heat, and at night, the area will stay warm as the stone re-emits the heat it absorbed during the day. Another major form of passive collector is thermos phonin walls and/or roof. With this passive collector, the heat normally absorbed and wasted in the walls and roof is re-routed into the area that needs to be heated.

The last major form of passive collector is the solar pond. This is very similar to the solar heated pool described above, but the emphasis is different. With swimming pools, the desired result is a warm pool. With the solar pond, the whole purpose of the pond is to serve as an energy regulator for a building. The pond is placed either adjacent to or on the building, and it will absorb solar energy and convert it to heat during the day. This heat can be taken into the building, or if the building has more than enough heat already, heat can be dumped from the building into the pond.

Solar energy can be used for other things besides heating. It may seem strange, but one of the most common uses of solar energy today is cooling. Solar cooling is far more expensive than solar heating, so it is almost never seen in private homes. Solar energy is used to cool things by phase changing a liquid to gas through heat, and then forcing the gas into a lower pressure chamber. The temperature of a gas is related to the pressure containing it, and all other things being held equal, the same gas under a lower pressure will have a lower temperature. This cool gas will be used to absorb heat from the area of interest and then be forced into a region of higher pressure where the excess heat will be lost to the outside world. The net effect is that of a pump moving heat from one area into another, and the first is accordingly cooled.

Besides being used for heating and cooling, solar energy can be directly converted to electricity. Most of our tools are designed to be driven by electricity, so if you can create electricity through solar power, you can run almost anything with solar power. The solar collectors that convert radiation into electricity can be either flat-plane collectors or focusing collectors, and the silicon components of these collectors are photovoltaic cells.

Photovoltaic cells, by their very nature, convert radiation to electricity. This phenomenon has been known for well over half a century, but until recently the amounts of electricity generated were good for little more than measuring radiation intensity. Most of the photovoltaic cells on the market today operate at an efficiency of less than 15%; that is, of all the radiation that falls upon them, less than 15% of it is converted to electricity. The maximum theoretical efficiency for a photovoltaic cell is only 32.3%, but at this efficiency, solar electricity is very economical. Most of our other forms of electricity generation are at a lower efficiency than this.

Unfortunately, reality still lags behind theory and a 15% efficiency is not usually considered economical by most power companies, even if it is fine for toys and pocket calculators. Hope for bulk solar electricity should not be abandoned, however, for recent scientific advances have created a solar cell with an efficiency of 28.2% efficiency in the laboratory. This type of cell has yet to be field-tested. If it maintains its efficiency in the uncontrolled environment of the outside world, and if it does not have a tendency to break down, it will be economical for power companies to build solar power facilities after all.

Of the main types of energy usage, the least suited to solar power is transportation. While large, relatively slow vehicles like ships could power themselves with large onboard solar panels, small constantly turning vehicles like cars could not. The only possible way a car could be completely solar powered would be through the use of battery that was charged by solar power at some stationary point and then later loaded into the car. Electric cars that are partially powered by solar energy are available now, but it is unlikely that solar power will provide the world’s transportation costs in the near future.

Solar power has two big advantages over fossil fuels. The first is in the fact that it is renewable; it is never going to run out. The second is its effect on the environment.

While the burning of fossil fuels introduces many harmful pollutants into the atmosphere and contributes to environmental problems like global warming and acid rain, solar energy is completely non-polluting. While many acres of land must be destroyed to feed a fossil fuel energy plant its required fuel, the only land that must be destroyed for a solar energy plant is the land that it stands on. Indeed, if a solar energy systems were incorporated into every business and dwelling, no land would have to be destroyed in the name of energy. This ability to decentralize solar energy is something that fossil fuel burning cannot match.

As the primary element of construction of solar panels, silicon, is the second most common element on the planet, there is very little environmental disturbance caused by the creation of solar panels. In fact, solar energy only causes environmental disruption if it is centralized and produced on a gigantic scale. Solar power certainly can be produced on a gigantic scale, too. Among the renewable resources, only in solar power do we find the potential for an energy source capable of supplying more energy than is used.

Suppose that of the 4.5×10¹⁷ kWh per annum that is used by the earth to evaporate water from the oceans we were to acquire just 0.1% or 4.5×10¹⁴ kWh per annum. Dividing by the hours in the year gives a continuous yield of 2.90×10¹⁰ kW. This would supply 2.4 kW to 12.1 billion people.

This translates to roughly the amount of energy used today by the average American available to over twelve billion people. Since this is greater than the estimated carrying capacity of the Earth, this would be enough energy to supply the entire planet regardless of the population.

Unfortunately, at this scale, the production of solar energy would have some unpredictable negative environmental effects. If all the solar collectors were placed in one or just a few areas, they would probably have large effects on the local environment, and possibly have large effects on the world environment. Everything from changes in local rain conditions to another Ice Age has been predicted as a result of producing solar energy on this scale. The problem lies in the change of temperature and humidity near a solar panel; if the energy producing panels are kept non-centralized, they should not create the same local, mass temperature change that could have such bad effects on the environment.

Of all the energy sources available, solar has perhaps the most promise. Numerically, it is capable of producing the raw power required to satisfy the entire planet’s energy needs. Environmentally, it is one of the least destructive of all the sources of energy. Practically, it can be adjusted to power nearly everything except transportation with very little adjustment, and even transportation with some modest modifications to the current general system of travel. Clearly, solar energy is a resource of the future.

Advantage of Solar Energy:

  1. Technology is easy
  2. Affordable cost
  3. Within the ability of poor’s
  4. Basically no maintenance cost
  5. Only source of energy is sunshine
  6. Energy source is cost free
  7. Environmental Pollution is less
  8. No emission
  9. Very few materials are required

Solar energy

read more
EEE

Battery Charge Controller for Solar System

Introduction

Electricity is the most potential for foundation of economic growth of a country and constitutes one of the vital infrastructural inputs in socio-economic development .The world faces a surge in demand for electricity that is driven by such powerful forces as population growth, extensive urbanization, industrialization and the rise in the standard of living.

Bangladesh, with its 160 million people in a land mass of 147,570sq km. In 1971, just 3% of Bangladesh’s population had access to electricity .Today that number has increased to around 50% of the population –still one of the lowest in the world-but access often amounts to just a few hours each day. Bangladesh claims the lowest per-capita consumption of commercial energy in South Asia, but there is a significant gap between supply and demand. Bangladesh’s power system depends on fossil fuels supplied by both private sector and state-owned power system. After system losses, the countries per installed capacity for electricity   generation can generate 3,900-4300 Megawatts of electricity per day; however, daily demand is near   6,000 Megawatts per day. In general, rapid industrialization and urbanization has propelled the increase in demand for energy by 10% per year. What further exacerbates Bangladesh’s energy problems is the fact the country’s power generation plants are dated and may need to be shut     down sooner rather than later.

There was no institutional framework for renewable energy before 2008; therefore the renewable energy policy was adopted by the government. According to the policy an institution, Sustainable & Renewable Energy Development Authority (SREDA), was to be established as a focal point for the promotion and development of sustainable energy, comparison of renewable energy, energy efficiency and energy conservation. Establishment of SREDA is still under process. Power division is to facilitate the development of renewable energy until SREDA is formed.

While the power sector in Bangladesh has witnessed many success stories in the last couple of years, the road that lies ahead is dotted with innumerable challenges that result from the gaps that exist between what’s planned versus what the power sector has been able to deliver. There is no doubt that the demand for electricity is increasing rapidly with the improvement of living standard, increase of agricultural production, progress of industries as well as overall development of the country.

Power Generation Scenery in Bangladesh

Severe power crisis compelled the Government to enter into contractual agreements for high-cost temporary solution, such as rental power and small IPPs, on an emergency basis, much of it diesel or liquid-fuel based. This has imposed tremendous fiscal pressure. With a power sector which is almost dependent on natural-gas fired generation (89.22%), the country is confronting a simultaneous shortage of natural gas and electricity. Nearly 400-800 MW of power could not be availed from the power plants due to shortage of gas supply. Other fuels for generating low-cost, base-load energy, such as coal, or renewable source like hydropower, are not readily available and Government has no option but to go for fuel diversity option for power generation.

When the present Government assumed the charge, the power generation was 3200 – 3400 MW against national demand of 5200 MW. In the election manifesto, government had declared specific power generation commitment of 5000 MW by 2011 and 7000 MW by 2013.

Over View of Electricity Last Couple of Year

To achieve this commitment, in spite of the major deterrents energy crisis and gas supply shortage, government has taken several initiatives to generate 6000 MW by 2011, 10,000 MW by 2013 and 15,000 MW by 2016, which are far beyond the commitment in the election manifesto. 2944 MW of power (as of Jan, 2012) has already been added to the grid within three years time. The government has already developed Power system Master Plan 2010. According to the Master Plan the forecasted demand would be 19,000 MW in 2021 and 34,000 MW in 2030. To meet this demand the generation capacity should be 39,000 MW in 2030. The plan suggested going for fuel-mixed option, which should be domestic coal 30%, imported coal 20 %, natural gas (including LNG) 25%, liquid fuel 5%, nuclear, renewable energy and power import 20%. In line with the Power system Master Plan 2010, an interim generation plan up to 2016 has been prepared, which is as follows:

Table 01: Plants Commissioned During 2009-2011

Power Generation Sector

2009 (MW)

2010 (MW)

2011 (MW)

TOTAL (MW)

Public

 –

255

800

1055

Private

356

270

125

751

Q. Rental

 –

250

838

1088

Total

356

775

1763

2894

  *In 2011, 1763 MW commissioned against plan for 2194 MW

Power Generation Units (fuel Type Wise)

Table 02: Installed Capacity of BPDB Power Plants as on April 2012

Plant Type

Total Capacity (in MW)

(%) Percentage in total developed power

Gas

5086.00 MW

75.99 %

HSD

682.00MW

10.19%

HFO

335.00 MW

5.01 %

Coal

250.00MW

3.74%

Hydro

230.00 MW

3.44 %

F.Oil

110.00MW

1.64%

Total

6693.00MW

100%

Table 03: Dreaded Capacity of BPDPB Power Plants as on April 2012

Plant Type

Total Capacity (in MW)

(%) Percentage in total developed power

Gas

4651.00 MW

76.74 %

HSD

657.00MW

10.84%

HFO

248.00 MW

4.09 %

Coal

200.00MW

3.3%

Hydro

220.00 MW

3.63 %

F.Oil

85.00MW

1.4%

Total

6061.00MW

100%

OWNER WISE DALY GENERATION REPORT

Table 04: Daily Generation of 25/04/2012

Owner Name

Derated Capacity(MW)

Day Peak(MW)

Eve. Peak(MW)

PDB

3209.00

1311.00

1516.00

SUB,PDB

223.00

51.00

104.00

EGCB

210.00

80.00

86.00

APSCL

662.00

539.00

567.00

IPP

1260.00

1021.00

1196.00

SIPP,REB

110.00

97.00

81.00

Rental(3 years)

33.00

15.00

0.00

SIPP,REB

215.00

150.00

156.00

Q.Rental 3Years

250.00

162.00

203.00

Rental 15 years

21.00

20.00

13.00

QRPP(5yars)

315.00

136.00

304.00

Others

0.00

49.00

60.00

RPP (3YEARS)

420.00

172.00

281.00

QRPP(3YEARS)

476.00

196.00

198.00

RPP(15YARS)

147.00

125.00

134.00

Total

7551.00

4124.00

4899.00

Table 05: Maximum Generation: Last Six Year

Maximum generation in 2012

6066.00MW as on 22-03-2012

Maximum generation in 2011

5174.00MW as on 23-11-2011

Maximum generation in 2010

4698.50MW as on 20-082010

Maximum generation in 2009

4296.00MW as on 18-09-2009

Maximum generation in 2008

4036.70MW as on 19-09-2008

Maximum generation in 2007

4130.00MW as on 17-09-2007

Maximum generation in history

6066.00MW as on 2908-2011

Electricity Demand and Supply

Per capita generation of electricity in Bangladesh is now about 252KWh. In view of the prevailing low consumption base in Bangladesh, a high growth rate in energy and electricity is indispensable for facilitating smooth transition from subsistence level of economy to the development threshold. The average annual growth in peak demand of the national grid over the last three decades was about 8.5%. It is believed that the growth is still suppressed by shortage of supply. Desired growth is generation is hampered, in addition to financial constraints, by inadequacy in supply of primary energy resources. The strategy adopted during the energy crisis was to reduce dependence on imported oil through its replacement by indigenous fuel. Thus almost all plants built after the energy crises were based on natural gas as fuel. Preference for this fuel is further motivated by its comparatively low tariff for power generation.

 Power Demand Forecasts (2010-2030)

The adoption scenarios of the power demand forecast in this MP are as shown in the figure below.

The figure indicates three scenarios; (i) GDP 7% scenario and (ii) GDP 6% scenario, based on energy intensity method, and (iii) government policy scenario.


FY

Government Policy Scenario

Comparison GDP (7%)

                  Scenario

Comparison GDP (6%)        Scenario

Peak Demand

     (MW)

Generation

   (GWH)

Peak Demand

      (MW)

Generation

     (GWH)

Peak Demand

   ( MW)

Generation

    (GWH)

2010

6454

33922

6454

33922

6454

33922

2011

6765

35557

6869

36103

6756

35510

2012

7518

39515

7329

38521

7083

37228

2013

8349

43882

7837

41191

7436

39084

2014

9268

48713

8398

44140

7819

41097

2015

10283

54047

9019

47404

8232

43267

2016

11405

59945

9705

51009

8680

45622

2017

12644

66457

10463

54994

9165

48171

2018

14014

73658

11300

59393

9689

50925

2019

15527

81610

12224

64249

10255

53900

2020

17304

90950

13244

69610

10868

57122

2021

18838

99838

14249

75517

11442

60640

2022

20443

109239

15344

81992

12056

64422

2023

21993

118485

16539

89102

12713

68490

2024

23581

128073

17840

96893

13416

72865

2025

25199

137965

19257

105432

14167

77564

2026

26838

148114

20814

114868

14979

82666

2027

28487

158462

22509

125209

15848

88156

2028

30134

168943

24353

136533

16776

94053

2029

31873

180089

26358

148928

17768

100393

2030

33708

191933

28537

162490

18828

107207

Table 06: Demand Forecast (3scenario)

Source: Power System Master Plan (PSMP) Study Team

FY- Forecast year*

INSTALLED CAPACITY

NEW GENERATION PLAN OF THE GOVERNMENT (From 2012 to2016) In MW

Power is the precondition for social and economic development. But currently consumers cannot be provided with uninterrupted and quality power supply due to inadequate generation compared to the national demand. To fulfill the commitment as declared in the Election Manifesto and to implement the Power Sector Master Plan 2010, Government has already been taken massive generation, transmission and distribution plan. The generation target up to 2016 is given below:

YEAR

2012

2013

2014

2015

2016

       TOTAL

PUBLIC

632MW

1467MW

1660MW

1410MW

750MW

5919MW

PRIVET

1354MW

1372MW

1637MW

772MW

1600MW

6735MW

IMPORT

0

500MW

0

0

0

500MW

TOTAL

1986MW

3339MW

3297MW

2182MW

2350MW

13154MW

Table 07: Power generation addition from 2009-11

     *2894 MW Power Generation addition from January 2009 to December 2011

Government Upcoming Nearest plan

Government has taken short, medium and long term plan. Under the short term plan, Quick Rental Power Plants will be installed using liquid fuels/gas and capable to produce electricity within 12-24 months. Nearly 1753 MW is planned to be generated from rental and quick rental power plants.

Under the medium term plan, initiatives have been taken to set up power plants with a total generation capacity of 7919 MW that is implementable within 3 to 5 years time. The plants are mainly coal based; some are gas and oil based. In the long term plan, some big coal fired plants will be set up, one will be in Khulna South and other will be in Chittagong, each of having the capacity of 1300 MW. Some 300-450 MW plants will be set up in Bibiana, Meghnaghat, Ashugonj, Sirangonj and in Ghorashal. If the implementation of the plan goes smoothly, it will be possible to minimize the demand-supply gap at the end of 2012.

Government has already started implementation of the plan. Total 31,355 Million-kilowatt hour (MkWh) net energy was generated during 2010-11. Public sector power plant generated 47% while private sector generated 53% of total net generation. The share of gas, hydro, coal and oil based energy generation was 82.12%, 2.78%, 2.49% and 12.61% respectively. On the other hand, in FY 2009-10, 29,247 million-kilowatt hour (MkWh) net energy was generated i.e. electricity growth rate in FY 2011 was 7.21% (In FY 2012 (Jul-Dec, 2011) is 13.2%).

Why do we select this project?

Now fuel crises are increasing day by day in worldwide and it impacts on energy sector to produce or generate electricity. Big amount of fuel from total reserved of fuel in our country is used to generate electricity.

Therefore the reserved fuel will be finish in the future. Analysis are thinking to make the strong energy sector with the rentable energy is one of the major part of the renewable energy to produce electricity and that is why we have chosen the solar energy system.

The solar system is constructed with various types of ingredients. But here the battery is the heart of the solar system. The solar energy is not used directly and it is used with the help of the battery because we get very low D.C voltage from the solar panel. Therefore we need to use the battery to store this low D.C voltage which is supplied from the solar panel. In a solar system, the 50% cost is expense for the battery from its total cost. Since the battery is a major part of the solar system and it is charged perfectly by a controller circuit. If the battery is not charged perfectly then the charge capacity will be decreasing in a very short time and it also can be damaged for the overcharging.

We have chosen the battery charge controller system by considering above reason.

An Introduction to Solar Energy

 The interest in renewable energy has been revived over last few year, especially after global awareness regarding the ill effects of fossil fuel burning. Energy is the source of growth and the mover for economic and social development of a nation and its people. No matter how we cry about development or poverty alleviation it is not going to come until lights are provided to our people for seeing, reading and working.

Natural resources or energy sources such as; fossil fuels, oil natural gas, etc. are completely used or economically depleted. Because we are rapidly exhausting, our non-renewable resources, degrading the potentially renewable resources and even threatening the perpetual resources. It demands immediate attention especially in the third world countries, where only scarce resources are available for an enormous size of population. The civilization is dependent on electric power. There is a relationship between GDP growth rate and electricity growth rate in a country.

Clearly, the present gas production capacity in Bangladesh can’t support both domestic gas needs,  as well as wider electricity generation for the country . On September 15th 2009, the Power Division of the Ministry of Power, Energy  and Mineral Resources of Bangladesh pushed for urgent action to be taken to improve the country’s energy outlook. The Power Division made recommendation such as ceasing gas supply to gas-fired power plants after 2012 to conserve gas reserves for domestic use.

The Government of Bangladesh is actively engaged in energy crisis management. The National Energy Policy has the explicit goal of supplying the whole country with electricity by 2020. Since 1996, the government has allowed private, independent power producer to enter the Bangladeshi market. It is already importing 100 Megawatts of power from India and has negotiated with private companies renting plants to buy power at higher rates.

It is impossible to conceive development of civilization without “Energy”.Densely populated country like Bangladesh can only sustain and progress if only latest energy technologies can be used efficiently. Government of Bangladesh is working towards achieving “Power i.e. Electricity for All” by the year 2020.Bangladesh is one of the most severely affected counties of the World due to climate change and global warming effects.

What Is Solar Energy?

Solar energy is energy that comes from the sun. Every day the sun radiates, or sends out, an enormous amount of energy. The sun radiates more energy in one second than people have used since the beginning of time!

Where does all this energy come from? It comes from within the sun itself. Like other stars, the sun is a big gas ball made up mostly of hydrogen and helium. The sun generates energy in its core in a process called nuclear fusion. During nuclear fusion, the sun’s extremely high pressure and hot temperature cause hydrogen atoms to come apart and their nuclei (the central cores of the atoms) to fuse or combine. Four hydrogen nuclei fuse to become one helium atom. But the helium atom weighs less than the four nuclei that combined to form it. Some matter is lost during nuclear fusion. The lost matter is emitted into space as radiant energy.

It takes millions of years for the energy in the sun’s core to make its way to the solar surface, and then just a little over eight minutes to travel the 93 million miles to earth. The solar energy travels to the earth at a speed of 186,000 miles per second, the speed of light. Only a small portion of the energy radiated by the sun into space strikes the earth, one part in two billion. Yet this amount of energy is enormous. Every day enough energy strikes the United States to supply the nation’s energy needs for one and a half years!

Where does all this energy go? About 15 percent of the sun’s energy that hits the earth is reflected back into space. Another 30 percent is used to evaporate water, which, lifted into the atmosphere, produce’s rain-fall. Solar energy also is absorbed by plants, the land, and the oceans. The rest could be used to supply our energy needs.

History of Solar Energy

People have harnessed solar energy for centuries. As early as the 7th century B.C., people used simple magnifying glasses to concentrate the light of the sun into beams so hot they would cause wood to catch fire. Over 100 years ago in France, a scientist used heat from a solar collector to make steam to drive a steam engine.

In the beginning of this century, scientists and engineers began researching ways to use solar energy in earnest. One important development was a remarkably efficient solar boiler invented by Charles Greeley Abbott, an American astrophysicist, in 1936.

The solar water heater gained popularity at this time in Florida, California, and the Southwest. The industry started in the early 1920s and was in full swing just before World War 11. This growth lasted until the mid- 1950s when low-cost natural gas became the primary fuel for heating American homes. The public and world governments remained largely indifferent to the possibilities of solar energy until the oil shortages of the 1970s. Today people use solar energy to heat buildings and water and to generate electricity.

Utilization of solar Energy

Solar energy, radiant light and heat from the sun, has been harnessed by humans since ancient times using a range of ever-evolving technologies. Solar radiation, along with secondary solar-powered resources such as wind and wave power, hydroelectricity and biomass, account for most of the available renewable energy on earth. Only a minuscule fraction of the available solar energy is used.

Solar powered electrical generation relies on heat engines and photovoltaic. Solar energy’s uses are limited only by human ingenuity. A partial list of solar applications includes space heating and cooling through solar architecture, potable water via distillation and disinfection, day lighting, solar hot water, solar cooking, and high temperature process heat for industrial purposes. To harvest the solar energy, the most common way is to use solar panels.

Solar technologies are broadly characterized as either passive solar or active solar depending on the way they capture, convert and distribute solar energy. Active solar techniques include the use of photovoltaic panels and solar thermal collectors to harness the energy. Passive solar techniques include orienting a building to the Sun, selecting materials with favorable thermal mass or light dispersing properties, and designing spaces that naturally circulate air.

There are main two ways we can produce electricity from the sun:

Photovoltaic Electricity – This method uses photovoltaic cells that absorb the direct sunlight just like the solar cells you see on some calculators.

Solar Thermal Electricity – This also uses a solar collector: it has a mirrored surface that reflects the sunlight onto a receiver that heats up a liquid. This heated liquid is used to make steam that produces electricity.

Solar System Descriptions

In today’s climate of growing energy needs and increasing environmental concern, alternatives to the use of non-renewable and polluting fossil fuels have to be investigated. One such alternative is solar energy.

Solar energy is quite simply the energy produced directly by the sun and collected elsewhere, normally the Earth. The sun creates its energy through a thermonuclear process that converts about 650,000,0001 tons of hydrogen to helium every second. The process creates heat and electromagnetic radiation. The heat remains in the sun and is instrumental in maintaining the thermonuclear reaction. The electromagnetic radiation (including visible light, infra-red light, and ultra-violet radiation) streams out into space in all directions.

Only a very small fraction of the total radiation produced reaches the Earth. The radiation that does reach the Earth is the indirect source of nearly every type of energy used today. The exceptions are geothermal energy, and nuclear fission and fusion. Even fossil fuels owe their origins to the sun; they were once living plants and animals whose life was dependent upon the sun.

Much of the world’s required energy can be supplied directly by solar power. More still can be provided indirectly. The practicality of doing so will be examined, as well as the benefits and drawbacks. In addition, the uses solar energy is currently applied to will be noted.

Due to the nature of solar energy, two components are required to have a functional solar energy generator. These two components are a collector and a storage unit. The collector simply collects the radiation that falls on it and converts a fraction of it to other forms of energy (either electricity and heat or heat alone). The storage unit is required because of the non-constant nature of solar energy; at certain times only a very small amount of radiation will be received. At night or during heavy cloud cover, for example, the amount of energy produced by the collector will be quite small. The storage unit can hold the excess energy produced during the periods of maximum productivity, and release it when the productivity drops. In practice, a backup power supply is usually added, too, for the situations when the amount of energy required is greater than both what is being produced and what is stored in the container.

Methods of collecting and storing solar energy vary depending on the uses planned for the solar generator. In general, there are three types of collectors and many forms of storage units.

The three types of collectors are flat-plate collectors, focusing collectors, and passive collectors.

Flat-plate collectors are the more commonly used type of collector today. They are arrays of solar panels arranged in a simple plane. They can be of nearly any size, and have an output that is directly related to a few variables including size, facing, and cleanliness. These variables all affect the amount of radiation that falls on the collector. Often these collector panels have automated machinery that keeps them facing the sun. The additional energy they take in due to the correction of facing more than compensates for the energy needed to drive the extra machinery.

Focusing collectors are essentially flat-plane collectors with optical devices arranged to maximize the radiation falling on the focus of the collector. These are currently used only in a few scattered areas. Solar furnaces are examples of this type of collector. Although they can produce far greater amounts of energy at a single point than the flat-plane collectors can, they lose some of the radiation that the flat-plane panels do not. Radiation reflected off the ground will be used by flat-plane panels but usually will be ignored by focusing collectors (in snow covered regions, this reflected radiation can be significant). One other problem with focusing collectors in general is due to temperature. The fragile silicon components that absorb the incoming radiation lose efficiency at high temperatures, and if they get too hot they can even be permanently damaged. The focusing collectors by their very nature can create much higher temperatures and need more safeguards to protect their silicon components.

Passive collectors are completely different from the other two types of collectors. The passive collectors absorb radiation and convert it to heat naturally, without being designed and built to do so. All objects have this property to some extent, but only some objects (like walls) will be able to produce enough heat to make it worthwhile. Often their natural ability to convert radiation to heat is enhanced in some way or another (by being painted black, for example) and a system for transferring the heat to a different location is generally added.

People use energy for many things, but a few general tasks consume most of the energy. These tasks include transportation, heating, cooling, and the generation of electricity. Solar energy can be applied to all four of these tasks with different levels of success.

Heating is the business for which solar energy is best suited. Solar heating requires almost no energy transformation, so it has a very high efficiency. Heat energy can be stored in a liquid, such as water, or in a packed bed. A packed bed is a container filled with small objects that can hold heat (such as stones) with air space between them. Heat energy is also often stored in phase-change or heat-of-fusion units. These devices will utilize a chemical that changes phase from solid to liquid at a temperature that can be produced by the solar collector. The energy of the collector is used to change the chemical to its liquid phase, and is as a result stored in the chemical itself. It can be tapped later by allowing the chemical to revert to its solid form. Solar energy is frequently used in residential homes to heat water. This is an easy application, as the desired end result (hot water) is the storage facility. A hot water tank is filled with hot water during the day, and drained as needed. This application is a very simple adjustment from the normal fossil fuel water heaters.

Swimming pools are often heated by solar power. Sometimes the pool itself functions as the storage unit, and sometimes a packed bed is added to store the heat. Whether or not a packed bed is used, some method of keeping the pool’s heat for longer than normal periods (like a cover) is generally employed to help keep the water at a warm temperature when it is not in use.

Solar energy is often used to directly heat a house or building. Heating a building requires much more energy than heating a building’s water, so much larger panels are necessary. Generally a building that is heated by solar power will have its water heated by solar power as well. The type of storage facility most often used for such large solar heaters is the heat-of-fusion storage unit, but other kinds (such as the packed bed or hot water tank) can be used as well. This application of solar power is less common than the two mentioned above, because of the cost of the large panels and storage system required to make it work. Often if an entire building is heated by solar power, passive collectors are used in addition to one of the other two types. Passive collectors will generally be an integral part of the building itself, so buildings taking advantage of passive collectors must be created with solar heating in mind.

These passive collectors can take a few different forms. The most basic type is the incidental heat trap. The idea behind the heat trap is fairly simple. Allow the maximum amount of light possible inside through a window (The window should be facing towards the equator for this to be achieved) and allow it to fall on a floor made of stone or another heat holding material. During the day, the area will stay cool as the floor absorbs most of the heat, and at night, the area will stay warm as the stone re-emits the heat it absorbed during the day. Another major form of passive collector is thermos phonin walls and/or roof. With this passive collector, the heat normally absorbed and wasted in the walls and roof is re-routed into the area that needs to be heated.

The last major form of passive collector is the solar pond. This is very similar to the solar heated pool described above, but the emphasis is different. With swimming pools, the desired result is a warm pool. With the solar pond, the whole purpose of the pond is to serve as an energy regulator for a building. The pond is placed either adjacent to or on the building, and it will absorb solar energy and convert it to heat during the day. This heat can be taken into the building, or if the building has more than enough heat already, heat can be dumped from the building into the pond.

Solar energy can be used for other things besides heating. It may seem strange, but one of the most common uses of solar energy today is cooling. Solar cooling is far more expensive than solar heating, so it is almost never seen in private homes. Solar energy is used to cool things by phase changing a liquid to gas through heat, and then forcing the gas into a lower pressure chamber. The temperature of a gas is related to the pressure containing it, and all other things being held equal, the same gas under a lower pressure will have a lower temperature. This cool gas will be used to absorb heat from the area of interest and then be forced into a region of higher pressure where the excess heat will be lost to the outside world. The net effect is that of a pump moving heat from one area into another, and the first is accordingly cooled.

Besides being used for heating and cooling, solar energy can be directly converted to electricity. Most of our tools are designed to be driven by electricity, so if you can create electricity through solar power, you can run almost anything with solar power. The solar collectors that convert radiation into electricity can be either flat-plane collectors or focusing collectors, and the silicon components of these collectors are photovoltaic cells.

Photovoltaic cells, by their very nature, convert radiation to electricity. This phenomenon has been known for well over half a century, but until recently the amounts of electricity generated were good for little more than measuring radiation intensity. Most of the photovoltaic cells on the market today operate at an efficiency of less than 15%; that is, of all the radiation that falls upon them, less than 15% of it is converted to electricity. The maximum theoretical efficiency for a photovoltaic cell is only 32.3%, but at this efficiency, solar electricity is very economical. Most of our other forms of electricity generation are at a lower efficiency than this.

Unfortunately, reality still lags behind theory and a 15% efficiency is not usually considered economical by most power companies, even if it is fine for toys and pocket calculators. Hope for bulk solar electricity should not be abandoned, however, for recent scientific advances have created a solar cell with an efficiency of 28.2% efficiency in the laboratory. This type of cell has yet to be field-tested. If it maintains its efficiency in the uncontrolled environment of the outside world, and if it does not have a tendency to break down, it will be economical for power companies to build solar power facilities after all.

Of the main types of energy usage, the least suited to solar power is transportation. While large, relatively slow vehicles like ships could power themselves with large onboard solar panels, small constantly turning vehicles like cars could not. The only possible way a car could be completely solar powered would be through the use of battery that was charged by solar power at some stationary point and then later loaded into the car. Electric cars that are partially powered by solar energy are available now, but it is unlikely that solar power will provide the world’s transportation costs in the near future.

Solar power has two big advantages over fossil fuels. The first is in the fact that it is renewable; it is never going to run out. The second is its effect on the environment.

While the burning of fossil fuels introduces many harmful pollutants into the atmosphere and contributes to environmental problems like global warming and acid rain, solar energy is completely non-polluting. While many acres of land must be destroyed to feed a fossil fuel energy plant its required fuel, the only land that must be destroyed for a solar energy plant is the land that it stands on. Indeed, if a solar energy systems were incorporated into every business and dwelling, no land would have to be destroyed in the name of energy. This ability to decentralize solar energy is something that fossil fuel burning cannot match.

As the primary element of construction of solar panels, silicon, is the second most common element on the planet, there is very little environmental disturbance caused by the creation of solar panels. In fact, solar energy only causes environmental disruption if it is centralized and produced on a gigantic scale. Solar power certainly can be produced on a gigantic scale, too. Among the renewable resources, only in solar power do we find the potential for an energy source capable of supplying more energy than is used.

Suppose that of the 4.5×10¹⁷ kWh per annum that is used by the earth to evaporate water from the oceans we were to acquire just 0.1% or 4.5×10¹⁴ kWh per annum. Dividing by the hours in the year gives a continuous yield of 2.90×10¹⁰ kW. This would supply 2.4 kW to 12.1 billion people.

This translates to roughly the amount of energy used today by the average American available to over twelve billion people. Since this is greater than the estimated carrying capacity of the Earth, this would be enough energy to supply the entire planet regardless of the population.

Unfortunately, at this scale, the production of solar energy would have some unpredictable negative environmental effects. If all the solar collectors were placed in one or just a few areas, they would probably have large effects on the local environment, and possibly have large effects on the world environment. Everything from changes in local rain conditions to another Ice Age has been predicted as a result of producing solar energy on this scale. The problem lies in the change of temperature and humidity near a solar panel; if the energy producing panels are kept non-centralized, they should not create the same local, mass temperature change that could have such bad effects on the environment.

Of all the energy sources available, solar has perhaps the most promise. Numerically, it is capable of producing the raw power required to satisfy the entire planet’s energy needs. Environmentally, it is one of the least destructive of all the sources of energy. Practically, it can be adjusted to power nearly everything except transportation with very little adjustment, and even transportation with some modest modifications to the current general system of travel. Clearly, solar energy is a resource of the future.

Advantage of Solar Energy:

  1. Technology is easy
  2. Affordable cost
  3. Within the ability of poor’s
  4. Basically no maintenance cost
  5. Only source of energy is sunshine
  6. Energy source is cost free
  7. Environmental Pollution is less
  8. No emission
  9. Very few materials are required

CHAPTER 03

Theory of solar cell charge Circuit

Equivalent circuit of a solar cell

To understand the electronic behavior of a solar cell, it is useful to create a model which is electrically equivalent, and is based on discrete electrical components whose behavior is well known. An ideal solar cell may be modeled by a current source in parallel with a diode; in practice no solar cell is ideal, so a shunt resistance and a series resistance component are added to the model. The resulting equivalent circuit of a solar cell is shown on the left. Also shown, on the right, is the schematic representation of a solar cell for use in circuit diagrams.

Characteristic equation

From the equivalent circuit it is evident that the current produced by the solar cell is equal to that produced by the current source, minus that which flows through the diode, minus that which flows through the shunt resistor:

I = IL − ID − ISH       

Where

  • § I = output current (amperes)
  • § IL = photo generated current (amperes)
  • § ID = diode current (amperes)
  • § ISH = shunt current (amperes).

The current through these elements is governed by the voltage across them:

Vj = V + IRS

Where

  •  Vj = voltage across both diode and resistor RSH (volts)
  •  V = voltage across the output terminals (volts)
  •  I = output current (amperes)
  •  RS = series resistance (Ω).

By the Shockley diode equation, the current diverted through the diode is:

Where

  •  I0 = reverse saturation current (amperes)
  • n = diode ideality factor (1 for an ideal diode)
  •  q = elementary charge
  •  k = Boltzmann’s constant
  •  T = absolute temperature
  • At 25°C,  volts.

By Ohm’s law, the current diverted through the shunt resistor is:

Where

  • § RSH = shunt resistance (Ω).

Substituting these into the first equation produces the characteristic equation of a solar cell, which relates solar cell parameters to the output current and voltage:

An alternative derivation produces an equation similar in appearance, but with V on the left-hand side. The two alternatives are identities; that is, they yield precisely the same results.

In principle, given a particular operating voltage V the equation may be solved to determine the operating current I at that voltage. However, because the equation involves I on both sides in a transcendental function the equation has no general analytical solution. However, even without a solution it is physically instructive. Furthermore, it is easily solved using numerical methods. (A general analytical solution to the equation is possible using Lambert’s W function, but since Lambert’s W generally itself must be solved numerically this is a technicality.)Since the parameters I0, n, RS, and RSH cannot be measured directly, the most common application of the characteristic equation is nonlinear regression to extract the values of these parameters on the basis of their combined effect on solar cell behavior.

 Basic Battery Charging Methods

Constant Voltage a constant voltage charger is basically a DC power supply which in its simplest form may consist of a step down transformer from the mains with a rectifier to provide the DC voltage to charge the battery. Such simple designs are often found in cheap car battery chargers. The lead-acid cells used for cars and backup power systems typically use constant voltage chargers. In addition, lithium-ion cells often use constant voltage systems, although these usually are more complex with added circuitry to protect both the batteries and the user safety.

Constant Current Constant current chargers vary the voltage they apply to the battery to maintain a constant current flow, switching off when the voltage reaches the level of a full charge. This design is usually used for nickel-cadmium and nickel-metal hydride cells or batteries.

Taper Current this is charging from a crude unregulated constant voltage source. It is not a controlled charge as in V Taper above. The current diminishes as the cell voltage (back emf) builds up. There is a serious danger of damaging the cells through overcharging. To avoid this charging rate and duration should be limited. Suitable for SLA batteries only.

Pulsed charge Pulsed chargers feed the charge current to the battery in pulses. The charging rate (based on the average current) can be precisely controlled by varying the width of the pulses, typically about one second. During the charging process, short rest periods of 20 to 30 milliseconds, between pulses allow the chemical actions in the battery to stabilize by equalizing the reaction throughout the bulk of the electrode before recommencing the charge. This enables the chemical reaction to keep pace with the rate of inputting the electrical energy. It is also claimed that this method can reduce unwanted chemical reactions at the electrode surface such as gas formation, crystal growth and passivation. (See also Pulsed Charger below). If required, it is also possible to sample the open circuit voltage of the battery during the rest period.

Burp charging also called Reflex or Negative Pulse Charging Used in conjunction with pulse charging, it applies a very short discharge pulse, typically 2 to 3 times the charging current for 5 milliseconds, during the charging rest period to depolarize the cell. These pulses dislodge any gas bubbles which have built up on the electrodes during fast charging, speeding up the stabilization process and hence the overall charging process. The release and diffusion of the gas bubbles is known as “burping”. Controversial claims have been made for the improvements in both the charge rate and the battery lifetime as well as for the removal of dendrites made possible by this technique. The least that can be said is that “it does not damage the battery”.

IUI Charging this is a recently developed charging profile used for fast charging standard flooded lead acid batteries from particular manufacturers. It is not suitable for all lead acid batteries. Initially the battery is charged at a constant (I) rate until the cell voltage reaches a preset value – normally a voltage near to that at which gassing occurs. This first part of the charging cycle is known as the bulk charge phase. When the preset voltage has been reached, the charger switches into the constant voltage (U) phase and the current drawn by the battery will gradually drop until it reaches another preset level. This second part of the cycle completes the normal charging of the battery at a slowly diminishing rate. Finally the charger switches again into the constant current mode (I) and the voltage continue to rise up to a new higher preset limit when the charger is switched off. This last phase is used to equalize the charge on the individual cells in the battery to maximize battery life. See Cell Balancing.

Trickle charge Trickle charging is designed to compensate for the self discharge of the battery. Continuous charge. Long term constant current charging for standby use. The charge rate varies according to the frequency of discharge. Not suitable for some battery chemistries, e.g. NiMH and Lithium, which are susceptible to damage from overcharging In some applications the charger is designed to switch to trickle charging when the battery is fully charged.

Float charge. The battery and the load are permanently connected in parallel across the DC charging source and held at a constant voltage below the battery’s upper voltage limit. Used for emergency power back up systems. Mainly used with lead acid batteries.

Random charging All of the above applications involve controlled charge of the battery, however there are many applications where the energy to charge the battery is only available, or is delivered, in some random, uncontrolled way. This applies to automotive applications where the energy depends on the engine speed which is continuously changing. The problem is more acute in EV and HEV applications which use regenerative braking since this generates large power spikes during braking which the battery must absorb. More benign applications are in solar panel installations which can only be charged when the sun is shining. These all require special techniques to limit the charging current or voltage to levels which the battery can tolerate.

Charge controller

A charge controller, charge regulator or battery regulator limits the rate at which electric current is added to or drawn from electric batteries.  It prevents overcharging and may prevent against overvoltage, which can reduce battery performance or lifespan, and may pose a safety risk. It may also prevent completely draining (“deep discharging”) a battery, or perform controlled discharges, depending on the battery technology, to protect battery life.   The terms “charge controller” or “charge regulator” may refer to either a stand-alone device, or to control circuitry integrated within a battery pack, battery-powered device, or battery recharger.

Charge controllers are sold to consumers as separate devices, often in conjunction with solar or wind power generators, for uses such as RV, boat, and off-the-grid home battery storage systems.   In solar applications, charge controllers may also be called solar regulators.  

A series charge controller or series regulator disables further current flow into batteries when they are full. A shunt charge controller or shunt regulator diverts excess electricity to an auxiliary or “shunt” load, such as an electric water heater, when batteries are full.  

Simple charge controllers stop charging a battery when they exceed a set high voltage level, and re-enable charging when battery voltage drops back below that level. Pulse width modulation (PWM) and maximum power point tracker (MPPT) technologies are more electronically sophisticated, adjusting charging rates depending on the battery’s level, to allow charging closer to its maximum capacity Charge controllers may also monitor battery temperature to prevent overheating. Some charge controller systems also display data; transmit data to remote displays, and data logging to track electric flow over time.

Circuitry that functions as a charge regulator controller may consist of several electrical components, or may be encapsulated in a single microchip, an integrated circuit (IC) usually called a charge controller IC or charge control IC

Charge controller circuits are used for rechargeable electronic devices such as cell phones, laptop computers, portable audio players, and uninterruptible power supplies, as well as for larger battery systems found in electric vehicles and orbiting space satellites. Charge controller circuitry may be located in the battery-powered device, in a battery pack for either wired or wireless (inductive) charging, in line with the wiring,or in the AC adapter or other power supply module.

CHAPTER 04

Design and Operation


Working principal of Solar Charge Controller:

The overall circuit can be divided by the following major parts:

  1. IC SG 3524
  2.  IC LM358
  3. Relay
  4. MOSFET
  5. Input/output Ports

The working principles of those major parts are provided below:

  1. IC- SG 3524: This is the heart of the controller circuit. The IC has 16 numbers of pins.
  • The Pin numbers 1 and 9 are mainly used for the controlling purpose.
  • The Pin numbers 6 and 7 work as a Pulse Width Modulator.
  • The Pin numbers 4, 5 and 8 used for grounding purpose.
  • The Pin number 11 and 14 are used to MOSFET triggering.
  • The Pin numbers 12, 13 used as collector.
  • The Pin numbers 2, 3, 10 and 16 not in used.
  • The Pin number 15 used to input voltage.

Here a 10k variable resister is used to increase and decrease the width of the pulses.

If the width of the pulse is increased then current becomes high current will be low when the width of the pulse is decreased.

  1. IC-LM 358: This is an Operational Amplifier IC used to general purpose of amplification. The IC has 8 numbers of pins.
  • The Pin number 1 provides the desire outputs to the relay unit.
  • The Pin number 2 get constant supply 5.1 volts from zener diode.
  • The Pin number 3 used as non inverting input.

Here a 10K variable register is used to select the value of the changing voltage.

Relay Unit: The relay of 12V DC which maintains a very important role for charge controlling. The magnetic contact of the relay energized when is depending with the charging period of OFF-ON. If charge is decreased then it becomes ON with the help of magnetic contact. If the battery is fully charged then it goes into the OFF mode. The diode IN4007 is used across the relay to defuse the back emf which is produced in the relay. It is very important for protection the relay.

 MOSFET: Here two N-channel MOSFET have been used because we are controlling the (-ve) terminal of the circuit. These two MOSFET are used to get higher current in the circuit. It is not possible to use more than two MOSFET because the pins 14N0 and 11N0 of I.C SG3524 are triggering the gate of MOSFET. There is a 10k variable resistor in this MOSFET which is used to select the max rating of the battery.

 Input/output Port: There are three ports in this circuit which are as follows:

  1. Solar Input Port
  2.  Battery Output Port
  3. DC Output Port

A very small amount of current produce in the solar cells when sun light hit the panel. The charging circuit collects those current by the solar input port.

The negative of the DC which controlled by the charging circuit meets with the negative of the battery output port. On the other side positive of the DC connected with the positive of the batter output port.

The battery output port provides the conventional DC to the battery. The DC output port provides   12 volts DC supply.

Solar Charge Controller Circuit Rating

Maximum Power


12.5 Watts


Maximum Power Voltage

21 Volts

Maximum Power Current

0.6 Ampere

Short Circuit Current

1.02 Ampere

Open Circuit Voltage

24.6 Volts

Operating Temperature

40—C

Required apparatus:

1. IC-SG3524

2. IC-LM358

3. Relay D.C (12v)

4. Transistor (NPN) B.C547

5. Zener diode 5.1v

6. Diode

* 1N4007, 1N5408

7. Variable resistor 10K

8. Capacitor

* 10µF, 1 µF

9. Resistor

* 1K, 10K , 100K, 47K, 22K, 150K

IC-SG3524:  

INVERT INPUT 1 16 VREF
NON-INV INPUT 2 15 VIN
OSC OUTPUT 3 14 EMITTER B
(+)CL SENSE 4 13 COLLECTOR B
(±)CL SENSE 5 12 COLLECTOR A
RT 6 11 EMITTER A
CT 7 10 SHUTDOWN
GROUND 8 9 COMPENSATION


DESCRIPTION

This monolithic integrated circuit contains all the control circuitry for a regulating power supply inverter or switching regulator. Included in a 16-pin dual-in-line package is the voltage reference, error amplifier, oscillator, pulse-width modulator, pulse steering flip-flop, dual alternating output switches and current-limiting and shut-down circuitry. This device can be used for switching regulators of polarity, transformer-coupled DC-to-DC converters, transformer less voltage doublers and polarity converters, as well as other power control applications. The SG3524 is designed for commercial applications of 0C to +70C.

FEATURES

Complete PWM power control circuitry

Single ended or push-pull outputs

Line and load regulation of 0.2%

1% maximum temperature variation

Total supply current is less than 10mA

Operation beyond 100 kHz

Description

The LM385 is a general purpose op-amp with 2 channels.

Applications include transducer amplifiers, dc amplification blocks, and all the conventional operational amplifier circuits that now can be implemented more easily in single-supply-voltage systems. For example, these devices can be operated directly from the standard 5-V supply used in digital systems and easily can provide the required interface electronics without additional ±5-V supplies

3. Relay D.C (12v) & Transistor (NPN) B.C547

Description

A relay is an electrically operated switch. Many relays use an electromagnet to operate a switching mechanism mechanically, but other operating principles are also used. Relays are used where it is necessary to control a circuit by a low-power signal (with complete electrical isolation between control and controlled circuits), or where several circuits must be controlled by one signal.

Description

BC547 is an NPN bi-polar junction transistor. A transistor, stands for transfer of resistance, is commonly used to amplify current. A small current at its base controls a larger current at collector & emitter terminals.

BC547 is mainly used for amplification and switching purposes. It has a maximum current gain of 800. Its equivalent transistors are BC548 and BC549.

The transistor terminals require a fixed DC voltage to operate in the desired region of its characteristic curves. This is known as the biasing. For amplification applications, the transistor is biased such that it is partly on for all input conditions. The input signal at base is amplified and taken at the emitter. BC547 is used in common emitter configuration for amplifiers. The voltage divider is the commonly used biasing mode. For switching applications, transistor is biased so that it remains fully on if there is a signal at its base. In the absence of base signal, it gets completely off.

5. Zener diode 5.1

Description:

A Zener Diode is a special kind of diode which permits current to flow in the forward direction as normal, but will also allow it to flow in the reverse direction when the voltage is above a certain value – the breakdown voltage known as the Zener voltage. Zener diodes are useful for creating a reference voltage or as a voltage stabilizer for low-current applications. These diodes are rated for 5.1 volts with a maximum of 1W. Price is for a single diode.

6. Diod 1N4007:

General Purpose Rectifier

Features

* Low forward voltage drop.

* High surge current capability.


7. Variable resistor 10K

Features:

*Power: 1/4W

*Resistance: 10K Ohm

*10K oHm Trimmer , Variable Resistors/ Trim pot Potentiometer

    8. Capacitor 10µ, 1µ:

A capacitor is a passive electronic component that stores energy in the form of an electrostatic field. In its simplest form, a capacitor consists of two conducting plates separated by an insulating material called thedielectric. The capacitance is directly proportional to the surface areas of the plates, and is inversely proportional to the separation between the plates. Capacitance also depends on the dielectric constant of the substance separating the plates

1.       Resistor:

A resistor is a passive two-terminal electrical component that implements electrical resistance as a circuit element. The current through a resistor is in direct proportion to the voltage across the resistor’s terminals. Thus, the ratio of the voltage applied across a resistor’s terminals to the intensity of current through the circuit is called resistance. This relation is represented by Ohm’s law:

 11. INPUT / OUTPUT PORT:

1N5408: General Purpose Rectifiers

Features

• 3.0 ampere operation at TA = 75°C

With no thermal runaway.

• High current capability.

•Lowleak

Solar Energy Development Environmental Considerations

Benefits of Solar: SUMMARY

  • Extends the Workday

It is dark by 6:30 year round in the equatorial latitudes. Electric lighting allows families to extend their workday into the evening hours. Many villages where SELF has installed solar lights now boast home craft industries.

  • Improves Health

Fumes from kerosene lamps in poorly ventilated houses are a serious health problem in much of the world where electric light is unavailable. The World Bank estimates that 780 million women and children breathing kerosene fumes inhale the equivalent of smoke from 2 packs of cigarettes a day.

  • Stems Urban Migration

Improving the quality of life through electrification at the rural household and village level helps stem migration to mega-cities. Also, studies have shown a direct correlation between the availability of electric light and lower birth rates.

  • Improves Fire-Reduction

Kerosene lamps are a serious fire hazard in the developing world, killing and maiming tens of thousands of people each year. Kerosene, diesel fuel and gasoline stored for lamps and small generators are also a safety threat, whereas solar electric light is entirely safe.

  • Improves Literacy

Electric light improves literacy, because people can read after dark more easily than they can by candle or lamplight. Schoolwork improves and eyesight is safeguarded when children study by electric light. With the advent of television and radio, people previously cut off from electronic information, education, and entertainment can become part of the modern world without leaving home.

  • Conserves Foreign Exchange

As much as 90% of the export earnings of some developing countries are used to pay for imported oil, most of it for power generation. Capital saved by not building additional large power plants can be used for investment in health, education, economic development, and industry. Expanding solar rural electrification creates jobs and business opportunities based on an appropriate technology in a decentralized marketplace.

  • Conserves Energy

Solar electricity for the Third World is clearly the most effective energy conservation program because it conserves costly conventional power for urban areas, town market centers, and industrial and commercial uses, leaving decentralized PV-generated power to provide the lighting and basic electrical needs of the majority of the developing world’s rural populations.

  • Reduces Maintenance

Use of a SHS rather than gensets or kerosene lamps reduces the time and expense of refueling and maintenance. Kerosene lamps and diesel generators must be filled several times per day. In rural areas, purchasing and transporting of kerosene or diesel fuel is often both difficult and expensive. Diesel generators require periodic maintenance and have a short lifespan. Car batteries, used to power TVs must often be transported miles for recharging. SHS, however, require no fuel, and will last for 20 years with minimal servicing.

Benefits of Solar: HEALTH

  • Reduces kerosene-induced fires

Kerosene lamps are a serious fire hazard in the developing world, killing and maiming tens of thousands of people each year. Kerosene, diesel fuel and gasoline stored for lamps and small generators are also a safety threat, whereas solar electric light is entirely safe.

Improves indoor air quality

Fumes from kerosene lamps in poorly ventilated houses are a serious health problem in much of the world where electric light is unavailable. The World Bank estimates that 780 million women and children breathing kerosene fumes inhale the equivalent of smoke from 2 packs of cigarettes a day.

  • Increases effectiveness of health programs

Use of solar electric lighting systems by rural health centers increases the quality of health care provided. Solar electric systems improve patient diagnoses through brighter task lighting and use of electrically-lit microscopes. Photovoltaic can also power televisions and VCRs to educate health workers and patients about preventative care, medical procedures, and other health care provisions. Finally, solar electric refrigerators have a higher degree of temperature control than kerosene units, leading to lower vaccine spoilage rates, and increased immunization effectiveness.

  • Allows telemedicine

Telemedicine is the use of telecommunications technology to provide, enhance, or expedite health care services, by accessing off-site databases, linking clinics or physicians’ offices to central hospitals, or transmitting x-rays or other diagnostic images for examination at another site. Deep in the Brazilian Amazon, SELF demonstrated the feasibility of telemedicine in remote areas by using a combination of solar power and satellite communications. Within moments of plugging in the new telemedicine device, local Caboclo Indians can have meaurements of blood pressure, body temperature, pulse, and blood-oxygen uploaded via satellite to the University of Southern Alabama for remote diagnosis.

Benefits of Solar: ENVIRONMENT

  • Reduces local air pollution

Use of solar electric systems decreases the amount of local air pollution. With a decrease in the amount of kerosene used for lighting, there is a corresponding reduction in the amount of local pollution produced. Solar rural electrification also decreases the amount of electricity needed from small diesel generators.

  • Offsets greenhouse gases

Photovoltaic systems produce electric power with no carbon dioxide (CO2) emissions. Carbon emission offset is calculated at approximately 6 tons of CO2 over the twenty-year life of one PV system.

  • Conserves energy

Solar electricity for the Third World is an effective energy conservation program because it conserves costly conventional power for urban areas, town market centers, and industrial and commercial uses, leaving decentralized PV-generated power to provide the lighting and basic electrical needs of the majority of the developing world’s rural populations.

  • Reduces need for dry-cell battery disposal

Small dry-cell batteries for flashlights and radios are used throughout the unelectrified world. Most of these batteries are disposable lead-acid cells which are not recycled. Lead from disposed dry-cells leaches into the ground, contaminating the soil and water. Solar rural electrification dramatically decreases the need for disposable dry-cell batteries. Over 12 billion dry-cell batteries were sold in 1993.

Benefits of Solar: EDUCATIONAL

  • Improves literacy

Solar rural electrification improves literacy by providing high quality electric reading lights. Electric lighting is far brighter than kerosene lighting or candles. Use of solar electric light aids students in studying during evening hours.

  • Increases access to news and information

Photovoltaics give rural areas access to news and educational programming through television and radio broadcasts. With the advent of television and radio, people previously cut off from electronic information, education, and entertainment can become part of the modern world without leaving home.

  • Enables evening education classes

Ongoing education classes and adult literacy classes can be held during the evening in solar-lit community centers. SELF has electrified community centers and schools in many countries, and has witnessed the development of adult literacy and professional classes possible with the introduction of solar electric lighting systems in community centers.

  • Facilitates wireless rural telephony

Solar electricity, when coupled with wireless communications, makes it possible to introduce rural telephony and data communication services to remote villages.

  • Solar Home Systems ROLE

Rural households currently using kerosene lamps for lighting and disposable or automotive batteries for operating televisions, radios, and other small appliances are the principal market for the SHS. Solar PV is affordable to an increasing segment of the Third World’s off-grid rural populations. For home lighting, the cost of an SHS is comparable to a family’s average monthly expenditure for candles, kerosene or dry-cell batteries. Besides providing lighting, an SHS can also power a small TV. In addition, families with an SHS need no longer purchase expensive dry-cell batteries to operate its radio-cassette player, which nearly every family has. Solar PV is competitive with its alternatives: kerosene, dry-cell batteries, candles, battery re-charging from the grid, Gensets, and grid extension.

Approximately 400,000 families in the developing world are already using small, household solar PV systems to power fluorescent lights, radio-cassette players, 12 volt black-and-white TVs, and other small appliances. These families, living mostly in remote rural areas, already constitute the largest group of domestic users of solar electricity in the world. For them, there is no other affordable or immediately available source of electric power. These systems have been sold mostly by small entrepreneurs applying their working knowledge of this proven technology to serve rural families who need small amounts of power for electric lights, radios and TVs.

The success of SHS implementation has been greatly determined by quality of the components and the availability of ongoing service and maintenance. When well-designed systems have received regular ongoing maintenance they have performed successfully over many years. However, when poorly designed components have been used, or when no after-sales service was available, systems often fail. A past failure of these systems has undermined local confidence. Fly-by-night salespeople have sold thousands of substandard SHS in South Africa, for example, which failed shortly after installation. Well-designed components and after-sales service and maintenance have become recognized as essential parts of a successful PV program.

Many of these SHS were provided by non-governmental organizations (like SELF) or through government-sponsored programs with international donor support, such as in Zimbabwe where 10,000 SHS are being installed on a financed, full-cost-recovery basis (in a program designed by SELF for the United Nations in 1991.) In Bolivia, 2,500 SHS are being leased to users by a cooperative “utility.” In Kenya, over 20,000 SHS have been installed since the mid-’80’s by independent businessmen on a strictly cash basis. The World Bank estimates that 50,000 SHS have been installed in China, 40,000 in Mexico, and 20,000 in Indonesia.

According to the United Nations Development Programme, 400 million families (nearly two billion people) have no access to electricity. The European Union’s renewable energy organization EuroSolar estimates the global market for solar photovoltaic home lighting systems is 200 million families. Based on market studies in India, China, Sri Lanka, Zimbabwe, South Africa and Kenya conducted by various international development agencies over the past 5 years, the consensus is that approximately 5% of most rural populations can pay cash for an SHS, 20 to 30% can afford a SHS with short or medium term credit, and another 25% could afford an SHS with long term credit or leasing.

Utility-scale solar energy environmental considerations include land disturbance/land use impacts, visual impacts, impacts associated with hazardous materials, and potential impacts on water and other resources, depending on the solar technology employed.

Solar power plants reduce the environmental impacts of combustion used in fossil fuel power generation such as green house gas and other air pollution emissions. However, concerns have been raised over land disturbance, visual impacts, and the use of potentially hazardous materials in some systems. These and other concerns associated with solar energy development are discussed below, and will be addressed in the Solar Energy Development Programmatic EIS.

·         Land Disturbance/Land Use Impacts

All utility-scale solar energy facilities require relatively large areas for solar radiation collection when used to generate electricity at a commercial scale, and the large arrays of solar collectors may interfere with natural sunlight, rainfall, and drainage, which could have a variety of effects on plants and animals. Solar arrays may also create avian perching opportunities that could affect both bird and prey populations. Land disturbance could also affect archeological resources. Solar facilities may interfere with existing land uses, such as grazing. Proper siting decisions can help to avoid land disturbance and land use impacts.

·         Visual Impacts

Because they are generally large facilities with numerous highly geometric and sometimes highly reflective surfaces, solar energy facilities may create visual impacts; however, being visible is not necessarily the same as being intrusive. Aesthetic issues are by their nature highly subjective. Proper siting decisions can help to avoid aesthetic impacts to the landscape.

·         Hazardous Materials

Photovoltaic panels may contain hazardous materials, and although they are sealed under normal operating conditions, there is the potential for environmental contamination if they were damaged or improperly disposed upon decommissioning. Concentrating solar power systems may employ liquids such as oils or molten salts that may be hazardous and present spill risks. In addition, various fluids are commonly used in most industrial facilities, such as hydraulic fluids, coolants, and lubricants. These fluids may in some cases be hazardous, and present a spill-related risk. Proper planning and good maintenance practices can be used to minimize impacts from hazardous materials.

·         Impacts to Water Resources

Parabolic trough and central tower systems typically use conventional steam plants to generate electricity, which commonly consume water for cooling. In arid settings, the increased water demand could strain available water resources. If the cooling water was contaminated through an accident, pollution of water resources could occur, although the risk would be minimized by good operating practices.

·         Other Concerns

Concentrating Solar Power (CSP) systems could potentially cause interference with aircraft operations if reflected light beams become misdirected into aircraft pathways. Operation of solar energy facilities and especially concentrating solar power facilities involves high temperatures that may pose an environmental or safety risk. Like all electrical generating facilities, solar facilities produce electric and magnetic fields. Construction and decommissioning of utility-scale solar energy facilities would involve a variety of possible impacts normally encountered in construction/decommissioning of large-scale industrial facilities. If new electric transmission lines or related facilities were needed to service a new solar energy development, construction, operation, and decommissioning of the transmission facilities could also cause a variety of environmental impacts.

Cost of Component & Conclusion

Cost of Components

Table 08: The electrical component cost for the generation of Inverter Circuit.

Name of Equipment

Unit Cost(TK)

Quantity

Cost (TK)


Resistors (1K, 10K , 100K, 47K, 22K, 150K  )

2.00

15

30.00

Diode 1N5408

2.00

11

22.00

Diode 1N4007

3.00

04

12.00

Transistor(NPN) BC 547

5.00

04

20.00

Capacitor 1µF 100v

3.00

02

6.00

Capacitor 1µF 50v

3.00

02

6.00

Capacitor10µF 50v

5.00

01

5.00

IC SG 3524

45.00

01

45.00

 IC LM358

10.00

01

10.00

MOSFET

5.00

02

10.00

PCB Board

1.00

Per inch

10.00

Hit Sink

8.00

Per inch

40.00

Relay D.C (12v)

22.00

01

22.00

Zener diode 5.1v

3.00

01

3.00

Variable resistor 10K

2.00

03

6.00

LED

5.00

02

10.00

Wire

15.00

1 meter

15.00

Panel board

1300.00

01

1300.00

Battery

1400.00

01

1400.00

Soldering Iron

130.00

01

130.00

Total cost=       3102

 Protection System:

We have taken some protections in this ckt. Such as:

               Back e.m.f protection:

  1. To protect from the back e.m.f that we connect across the rectifier diode of the relay.
  2. We used a rectifier diode across Battery Input port for protect the ckt. From back e.m.f of load.

            Temperature protection:

  1. To reduce the temperature of the MOSFET we used hit sink.

Over charge protection:

  1. To Protect over charging of the battery we used relay.

Conclusion

The main source of electricity generation in Bangladesh is the natural gas (about 82.69%, in the fiscal year 2008-09 its value was 4542MW). Natural gas produce the heat require driving the turbine which produces electricity. The reserve of natural gas is reducing day by day. To reduce the consumption of natural gas, Government has closed the production of some industry due to inadequate electricity supply (Ghorasal fertilizer, polash fertilizer etc). But the reserve of natural gas is now inadequate, an alternative should be employed. Solar energy is a very good option.

Bangladesh is a country with enough solar radiation to provide potential for sustaining SHS. From this radiation using the current available technology full demand of electricity can be overcome. But both the PV system and thermal system is very costly. This cost is high to consumer so government should take steps to setup solar energy plant.

At present, the solar home systems are not costly competitive against conventional fossil fuel based grid interfaced power sources because of the initial capital cost. However, to fulfill the basic needs for the consumer and improvements in alternative energy technologies bear good potential for widespread uses of such systems.

The proposed system feasibility may be a costly issue in respect of Bangladesh. However, it is possible to overcome by introducing some incentives offered by the government and utility companies. It can also be implemented in commercial building, telecommunication sector and water pumping for irrigation.

The Government of the people’s republic of Bangladesh is trying to meet the national electricity demand through various ways including installing Solar system. PV Solar energy conversion is only renewable energy source currently in operation in our country.

Solar thermal system is currently popular technology for producing electricity in megawatt scale. At latest technology it is equivalent to nuclear plant (Mojave solar park – 220,000 megawatts per year) without the radioactive dangers or the giant cooling towers to clog up the skyline. It is costly but in 10 years the cost can be recovered. (It doesn’t require any fuel!). So government should think about it.

If we can produce solar cell in our country the PV system cost will become 60% of current cost. Some organization in private sector already started assembling of solar panel to produce electricity. But the Government should take more steps toward about the solar cell production inside the country.                                                                                                                                                                                                                                                                                                                                                                                                                                                

  • Bangladesh has got ample solar insulation throughout the country. Daily average solar radiation varies from 4 to 6.5 kWh/m2. Maximum amount of radiation is available on the month of March- April and minimum on December-January. There is bright prospect for applications of solar thermal and photovoltaic systems in the country.
  • All Non-renewable have emission which global warming and destruction to environment
  • All renewable energy need external source but solar absolutely independent.
  • Among all energy solar is less polluting
  • Among all energy solar is less costly
  • Of all the energy sources available, solar has perhaps the most promise.
  • Solar energy is free,
  • No one regulates sunlight, it’s already ours.
  • Recycle , recharge, reuse battery
  • Campaign for green energy
  • Campaign for waste disaster
  • At present has no concentrating panel system so initiatives to be taken to install concentrating solar thermal generating system.

read more
EEE

Telecommunications and Networks

Basic purpose of this lecture is to present on Telecommunications and Networks. Here identify several major developments and trends in the industries, technologies and business applications of telecommunications and Internet technologies. Also provide examples of the business value of Internet, intranet and extranet applications. Finally identify the basic components, functions, and types of telecommunications networks used in business. And explain the functions of major types of telecommunications network hardware, software, media, and services.

read more
EEEScience

Coal as a Source of Electrical Energy in Bangladesh

INTRODUCTION

Electrical power is the corner stone of national economy. Electricity can be generated from many sources. Fossil fuel – oil, coal and natural gas dominates power generation. World reserve of fossil fuel resource is fast depleting .Moreover, burning of non fossil fuel is triggering global warming through green house gas emission. Floods, draught, cyclones, tornados, bushfires are causing massive destruction in different countries. People are turning to renewable sources – solar, wind, wave, geothermal, hydroelectricity, nuclear power generation is also getting popularity. Most of the countries have well crafted and professionally managed energy policy. Many countries have regional energy grid for energy trading.

Bangladesh is very lucky that it has got substantial natural gas reserve and significant but almost untapped high quality coal resource. There is also plenty of scope to generate solar power, wind power and energy from bio fuels. Many countries of the world like Japan, Korea do not have any fossil fuel resource yet they are among the top developed nations. They import almost their entire requirement of the fuel for energy generation from highly competitive energy market. Several countries do not have enough basic fuel to meet their huge demand. These countries import energy from energy rich countries to fuel their economy.

Unfortunately our small country Bangladesh of 160 million people has no appropriate strategy. There is an energy policy which is not properly administered.

Electricity generation in Bangladesh is overwhelmingly gas based. More than 85 percent of evening peak demand is catered by natural gas .This is followed at a distant by liquid fuel, and coal with generation shares of 6.76 percent and 5.41 percent respectively. Hydropower accounts for insignificant 2.45 percent of generation. The fuel mix if recalculated using the derated generation capacity, share of gas based generation reduces marginally to 83.45percent; share of liquid fuel and hydro based generation increases to 7.55 percent and 4.60 percent respectively.

The production and supply of natural gas is grossly inadequate. Natural gas is also used as feedstock for fertilizer production, as fuel for many industries, as compressed natural gas for automobiles. It is also used by commercial and domestic consumers. It is said that against a national demand of 2200 MMCFD our production capacity is 1880MMCFD Consequently the deficit is seriously impacting upon power generation and operation of fertilizer plants and other gas using industries. For several years some international oil companies having exploration rights in several exploration blocks did not do any work and now most of them are relinquishing these blocks. Petrobangla companies also failed to implement reservoir reassessment of major gas fields and expand production. So It is not in a position to carry out all its responsibilities. In this situation the remaining 6tcf reserve of natural gas may run out by 2015 if no new discovery is made soon

Bangladesh is now suffering from the worst energy crisis of its history. Entire country is suffering from 8-10 hours load shedding on the average despite of the fact that only 35% of its 15 million people have direct access to power supply. Industrial growth has come to almost standstill due to inadequate gas supply. Existing industries cannot be operated properly due to unsteady supply of energy.

The coal reserves in five fields of Bangladesh are estimated at 3.0 billion tonnes equivalent to 67 tcf of gas, which can conveniently serve the energy needs of Bangladesh for 50 years. Recovery rate of coal from reserves varies with the choice of technology and method of mining. If modern mining technology can be adopted ensuring strong regulatory supervision and monitoring about 85% coal from Barapukuria, Phulbari and Dighipara can be recovered. Khalaspeer can be ideal candidate for Coal Seam methane while we can wait for some years for technological development for mining giant Jamalganj coal mine.

Now, appropriate strategy should be adopted to explore and exploit coal, the only other major energy resource. In the present crisis situation it is felt prudent to discuss about coal situation in Bangladesh. From the information presented in a recent discussion in Dhaka we find Bangladesh does not have any choice but to start coal mining without delay adopting technically appropriate and economically feasible and environmentally friendly mining method.

PRESENT STATE OF ELECTRICITY IN BANGLADESH

Bangladesh is an energy hungry country. Power infrastructure of Bangladesh is small and insufficient but the demand is rapidly increasing. The per capita power consumption in Bangladesh is about 136kwh which is one of the lowest in the world but for huge population density our power sector is in enormous pressure. In Bangladesh, electricity is the major source of power and most of the economical activities depends on electricity.

Generation of electricity

Total electric power generation (installed) capacity of Bangladesh is 5823MW [BPDP, June 2010] and only three-fourth of which is considered to be available. The present [Feb, 2011] effective power generation capacity per day is about 4000 MW and the demand is 5000MW.  Only 40% of our total population has the access to electricity and in rural areas it is less than that .

Table  Electricity generation per year (from 2003 to 2011)

Year Electricity – production(kwh) Percent Change Date of Information
2003 15,330,000,000 2001
2004 15,330,000,000 0.00 % 2001
2005 16,450,000,000 7.31 % 2002
2006 17,420,000,000 5.90 % 2003
2007 18,090,000,000 3.85 % 2004
2008 22,780,000,000 25.93 % 2007 est.
2009 22,780,000,000 0.00 % 2007 est.
2010 22,990,000,000 0.92 % 2007 est.
2011 25,620,000,000 11.44 % 2009 est.

In past few years, generation of electricity have been increases in a considerable amount but demand increases more than that, so our generation plants have been unable to meet system demand for a long time.

 Bangladesh has small reserves of oil and coal, but potentially very large natural gas resources that’s why, most of the generation plant used natural gas as fuel. Some coal, diesel, furnace oil is also used in production of electric power. About 87% of our total electric power is produced by natural gas, 5.75 % by furnace oil, 4.29 % by coal, 3.19 % by diesel and 3.95 % is produced from hydro electric plant.

Generation (installed) capacity by fuel type

Figure Generation (installed) capacity by fuel type(as june 2010)

Distribution and consumption

In Bangladesh, electricity distribution system in controlled by national grid. Total electric power, generated from the power plants is first supplied to the national grid then to the hole counrty through national grid. The Padma-Jamuna-Meghna river divides power distribution sytem  into two zones, East and West. The East contains nearly all of the country’s electric generating capacity, while the West, with almost no natural resources, must import power from the East. Electricity interconnection from the East to the West was accomplished in 1982 by a new, 230-kilovolt (kV) power transmission line. The vast majority of Bangladesh’s electricity consumption takes place in the East, with the entire region west of the Jamuna River accounting for only 22% of the total. There are many organizations to distribute electric power in hole country. Dhaka electric supply authority (desa),   Dhaka electric supply company (desco), dhaka power development corporation (DPDC),  rural electrification board (REB), west zone power development company limited (WZPDCL) etc. All of these companies have their own power demand and the demand is given below in the chart-

 3 Consumption pattern of electric power

Figure  Consumption pattern of electric power (%)

In last few years power consumption in bangladesh is increased in such a high rate that, inspite of  increasing the power generation in a considerable amount , our power system doesn’t meet the goal and still we have a large amount of power shortage. Power consumption of last few years are as following –

Table Yearly power consumption (from 2003 to 2011)

year Electricity – consumption(kwh) Percent Change Date of Information
2003 14,260,000,000 2001
2004 14,250,000,000 -0.07 % 2001
2005 15,300,000,000 7.37 % 2002
2006 16,200,000,000 5.88 % 2003
2007 16,820,000,000 3.83 % 2004
2008 21,370,000,000 27.05 % 2006 est.
2009 21,370,000,000 0.00 % 2006 est.
2010 21,380,000,000 0.05 % 2007 est.
  2011 23,940,000,000 11.97 %                      2009 est.

yearly electric power consumption

Figure : yearly electric power consumption

key problems in power sector

Load shedding and voltage variation

The state-owned Bangladesh Power Development Board (BPDB), which controls nearly three-fourths of the total generation capacity in Bangladesh, has resorted to load shedding as a means to reconcile demand to the available capacity. Load shedding is a significant constraint on growth of the economy.

 Operating Inefficiency

The power sector does not fare well in terms of operating efficiency. For example, Bangladesh requires considerably more employees per customer served than is the case in many countries.

System loss

System loss occurs both for technical reasons and for reasons of inefficiency and corruption in administration. Exact figures of loss are unknown but, at approximately 30 per cent, the net country-wide system loss is probably among the highest in the developing world. The losses incurred differ dramatically across the various utilities.
 Unadjusted tariff structures and ineffective billing procedures

Many countries have been unable to establish tariff structures and billing procedures that enable the power sector to be financially self-supporting. The resulting losses require subsidies from government or donor agencies that divert revenue away from other important programmes,such as education and public health. This problem has afflicted the Bangladesh power sector entities to varying degrees.

Recommendations

Bangladesh is a developing country and most serious challenges we faces is power crisis. What ever we forecast for demand but our calculation failed because if you produce right now 7000 megawatt, it will fulfill with in a very short time because of many development and industries are waiting for power. If power is available, we will see many new projects, industries will consume immediately.

In electricity, when we save power it means we produce power. If somebody save 100 watt, another user can use that power. Therefore energy efficiency is essential in every electric product. All the develop world even India also have energy efficiency authority to motivate and regulating energy efficiency policy.

Now, let’s see in which sector we can reduce use of energy and some policy to motivate the people.

Industrial Sector

Major energy use in industrial sector and there are inductive and non inductive load. In our country, there are no major rules or not applied properly the rules for machine use. Like many industry using motor and sometimes those motor are not efficient at all and may be it will be recondition or old enough to be an efficient motor. Most of the inductive load do not have soft starter. Even in general use of water pump, there are no standard efficient level for selecting pump. Therefore people using 2500 tk water pump and that same 1 hp pump, in good branded one will be 7500 or higher. But people choose low price one which will destroy power and less efficient.

Air condition

Now on days, we are used to use of these products. It is inductive load and consumed good amount of energy. Nobody cares to reduce the temp level or efficient products. Recently, at the same price, many manufacture offering 50% less power but same BTU because they are using DC motor. Therefore high tax, high electricity unit price where higher then 3-5 kilo residential load needed. But it may not be possible due to political and public emotion purpose. But still there are no substitutes to make energy expensive then people will careful to use of energy.

Lighting purpose

We came to new energy saving age and using cfl bulb or tube. It will save energy sure but it cause heavy damage in environmental. Every cfl contain mercury and emit UV. UV is harmful for our skin and mercury is highly radioactive poison. When any bulb damage in our room, we have to keep vacant that room and open door, windows because of mercury vapor. After that we send it outside or sale. If it is goes to river, soil it will damage the water and its poison circle will start. It affect drinking water, fish and we take water or fish and cause cancer, unborn child defect, etc. Some tube light THD level also too high which decrease gird performance. we can use LED light in this purpose. It is environmental friendly, long life (50000 Hrs where cfl is 3000 to 5000 hrs), very less energy consume even one third comparing cfl. As it is still expensive, we can use certified cfl and rules and regulation for recycling cfl. Another thing is still now; customs do not have HS code or tax structure for led light, bulb or tube. Led light must have duty/ tax free access.

BTS for mobile operator

 Bangladesh has rapidly expanding mobile uses and according to that base transmission station also need. Now, 25000 over BTS running and more 7000 or more coming within 2 years. For mobile company, energy unit rate must have different category (high). Every BTS they use 2 pc 1 ton air conditioner which run round the clock. Now, if we calculate everyday 18 hrs air condition running this means 32.4 kilo only air condition. 32.4 times 25000 = 810000 kilo everyday 810 megawatt everyday.

 Future plan

In Bangladesh ,crisis in power sector becomes one of the major problems .some recent steps and a strong and clear forecasting is needed to overcome that problems .power sector is always been one of the major priority for Bangladesh government . To overcome the problems, a large and clear future plan is been taken by Bangladesh government.

It is estimated that power demand of our country will be almost double in upcoming 5 years.

Energy advisors press meet produced some important figures as can be seen below-

Table  Estimated Demand [ MW Per Day ] Supply Gap

Year 2010 2011 2012 2013 2014 2015 2016
Max Demand 6454 6765 7518 8349 9268 10283 11405
New Generation

Public Sector

255 851 838 1040 1270 450 1500
New Generation Private Sector 520 1343 1319 1134 1053 1900 1300
Power Import 500      
Capacity Retired   58 83 161 1292 128 1033
Generation Capacity 5936 8042 10116 12629 13660 15882 17649
NET 5499 7720 9 12124 13114 15247 16543
Dependable Capacity[Dec2010] 4331 5945 7575 9578 10491 12197 13554
Maximum  supply Shortage In Summer 2123 520 57 + 1229 + 1223 + 1914 +2149


yearly increasing demand ( in MW )

Figure  yearly increasing demand ( in MW )

Bangladesh government will increase power generation to reach their goal of ‘load shedding free Bangladesh ” , for that a large number of power new plant will be installed in next 5 years.

Some of the future projects given below –

Power plant in Sirajgonj

 Prime Minister of Bangladesh Sheikh Hasina recently (4th april,2011) laid foundation stone of 150 megawatt peaking power plant at Saidabad in the district. Hasina also inaugurated expansion works of the Saidabad-Enayetpur road and reopened the much-expected Sirajganj National Jute Mills previously known as Qaumi Jute Mills.

Chittagong power to get Canadian help

A Canadian company has expressed its interest in generating electricity from the domestic waste produced by the Chittagong city people every day. CEO of Canadian Company Technology Not Theory (TNT) Steve Smith expressed the interest to the Mayor of CCC in meeting with the mayor recently. The project is fully environment friendly and pollution free, Smith pointed.

Power Grid Company installing substation

The Power Grid Company of Bangladesh recently signed an agreement with German company Siemens to install a substation that would link about 30 kilometers grid interconnection between Bangladesh and India to import 500MW electricity from 2012.

BGMEA to set up power plant

Bangladesh Garment Manufacturers and Exporters Association (BGMEA), apex body of the readymade garment (RMG) industry, will shortly begin a technical assessment on setting up small, area-based power plants. The BGMEA move came in response to Prime Minister (PM) Sheikh Hasina’s call recently to set up such power plants to meet industry demand.

North West power generation company to install 810 MW power plant

North-West Power Generation Company (NWPGCO), a newly formed state-owned power company, is set to install 810 MW power project in the northwestern part of the country to address nagging power crisis of the area.

Bangladesh and India power transmission deal

Bangladesh and India signed a power transmission agreement for electricity to be imported to energy-starved Bangladesh.

Initially, 250 megawatts of power would be available to Bangladesh from India, with transmission to start in 2012.

Under the deal, state-owned Power Grid Corporation of India Ltd. will invest and construct 50 miles of transmission line, which it will own, operate and maintain. PGCIL will recover the construction costs under a fixed rate over 35 years.

While the agreement is limited to importing 500 megawatts of electricity from India, state-owned Bangladesh Power Development Board Chairman Alamgir Kabir said that more interconnections might be built in the future with Nepal, Bhutan and Myanmar to ensure greater energy security

Bangladesh and Russia deal

In May 2011, Bangladesh and Russia signed a framework agreement for Bangladesh’s first nuclear plant, expected to produce at least 2,000 megawatts of electricity by 2020. Bangladesh aims to have nuclear energy account for 10 percent of its total power generation by that time.

Some other Future power plants

Govern take a plan to produce  4500MW more power by installing some new power plantds. List of the plants and their capacity is given below –

Table Future power plant

Location Fuel Capacity Implementation
Nabiganj , Bibiyana Natural Gas 450 Combined Cycle Plant 2013
Siarjgonj Natural Gas 450 Combined Cycle Plant 2013
Meghnaghat unit 2   & 3 Natural Gas 2 unit each 450 Combined Cycle Plant 2013
Bheramara Natural Gas 450 Combined Cycle Plant 2014
Horipoor Natural Gas 300 MW Combined Cycle 2014
Chanddpoor Dual Fuel 150 MW CCP 2014
Khulna Dual Fuel 250 MW CCP 2014
Siddhiragnj Natural Gas 2×150 = 300 MW Peaking Plants 2014
Phulbari Coal Fired using Clean Coal Technology 2×500= 1000MW 2014
Mongla Coal Fired using Clean Coal Technology 500MW 2014
Total 4750MW 2014

Government to set up coal based power plant

According to Power System Master Plan (PSMP) the government has planned to set up eight new power plants with 4,000MW capacity by the year 2015. The government has primarily identified 13 places to install coal based power plants and now trying to install four plants at Khulna, Mongla, Meghnaghat and Chittagong areas, Taking into consideration the fast-growing demand of power consumption amid scanty supply, the PSMP has also taken up a mega-plan for producing about 20500MW additional electricity in 20 years from 2005 to 2025 by setting up 30 new plants. Bangladesh government needs US dollar six billion to implement coal power projects to meet the increased demand of electricity in the country. Of the plants, eight or more will be installed in the country’s north and northeastern regions where demand for electricity is increasing at a galloping rate of seven percent, in order to achieve this goal the development of Barapukuria and Phulbari should be more intensive.

Natural Gas

Natural gas is a major source of electricity generation through the use of gas turbines and steam turbines. Most grid peaking power plants and some off-grid engine-generators use natural gas. Natural gas burns more cleanly than other fuels, such as oil and coal, and produces less carbon dioxide per unit of energy released. For an equivalent amount of heat, burning natural gas produces about 30% less carbon-dioxide than burning petroleum and about 45% less than burning coal.

In Bangladesh natural gas is most important indigenous source of energy that accounts for 75% of the commercial energy of the country. About 89% of the electricity generated in the country comes from gas fired power plants. Installed capacity of Electricity generation by gas is steam-2638 MW (45.31%), Gas turbines-1466 MW (25.18%), combined cycle-1263 MW (21.69%). So far in Bangladesh 23 gas fields have been discovered with the rate of success ratio is 3.1:1 of which two of the gas fields are located in offshore area. Gas is produced from 17 gas fields (79 gas wells). To reduce the dependency on natural gas, alternative energy resource must be explored. Average daily gas production capacity is about 2000 mmcfd of which International Oil Companies (IOC) produce 1040 mmcfd and State Owned Companies (SOC) produce 960 mmcfd. At present the daily approximate projected gas demand throughout the country is 2500 MMCFD. The demand is increasing day by day. Energy and Mineral Resources Division (EMRD) has already undertaken an array of short, medium, fast track and long term plans to increase gas production to overcome prevailing gas shortage. After completion of these plans production capacity is expected to increase to about 2353 MMCFD gas by December 2015. To increase the gas production more programs will be taken in near future.

Oil

Oil is another source of electricity generation. Bangladesh is not a oil enriched country. Diesel, Furnace oil (HFO) are generally used in Bangladesh to produce electricity. Here 226 MW (3.87%) electricity generates from Diesel.  To meet the total demand of commercial energy, Bangladesh imports annually about 1.3 million metric Tons of crude oil. In addition to this, another 2.7 million metric Tons (approx) of refined petroleum products per annum is imported. Condensate is mixed with crude oil. Major consumer of liquid fuel is transport sector followed by agriculture, industry and commercial sector which is mostly met by imported liquid fuel. Eastern Refinery Limited (ERL), a subsidiary company of Bangladesh Petroleum Corporation (BPC), is capable of processing 1.3 million metric Tons of crude oil per year.

Oil was tested in two of the gas fields (Sylhet and Kailashtila). Crude oil, the liquid form of hydrocarbon, has been discovered in commercial quantity only in the Haripur oil field in Sylhet. The oil field has an estimated in-place oil reserve of about 10 million barrels, with a recoverable reserve of about 6 million barrels. The oil field produced 0.56 million barrels of oil in six years. Khulna Power Company Limited is one of the main oil based power station of Bangladesh. Furnace oil is its main fuel.

Renewable Energy

Renewable energy is the energy which comes from natural resources such as sunlight, wind, rain, tides, water, and geothermal heat, which are renewable (naturally replenished). In 2008, about 19% of global final energy consumption came from renewable, with 13% coming from traditional Biomass, which is mainly used for heating, and 3.2% from hydroelectricity. New renewable (small hydro, modern biomass, wind, solar, geothermal, and bio fuels) accounted for another 2.7% and are growing very rapidly. The share of renewable in electricity generation is around 18%, with 15% of global electricity coming from hydroelectricity and 3% from new renewable.

Hydroelectricity

Karnafuli Hydro Power Station the only hydropower plant in the country is located at kaptai, about 50 km from the port city of chittagong. This plant was constructed in 1962 as part of the ‘Karnafuli Multipurpose Project’, and is one of the biggest water resources development project of Bangladesh. After being commissioned in 1962, the plant could feed the national grid with 80 MW of electricity. In later years, the generation capacity was increased in two phases to a total of 230 MW which is 3.95% of total generated electricity. The plant not only plays an important role in meeting the power demand of the country but is also vital as a flood management installation for the areas downstream.

In future hydroelectricity will be a probable sector of power generation of Bangladesh. Possibility of installing mini and micro level hydro-electric power plant in the hilly areas of Bangladesh would be explored.

Solar Energy 

Solar energy is the energy derived from the sun through the form of solar radiation. Potential of solar energy is good in Bangladesh. Bangladesh is a poor country and it’s a huge cost to established a power plant. Consequently, the only option that is open to Bangladesh at the moment is renewable energy such as solar and hydro-electric. Particularly solar energy is sufficiently abundant in Bangladesh and can fruitfully be harnessed. But due to its higher cost of equipment it has to go a long way to become commercially viable. However, in remote areas of Bangladesh it is gradually becoming popular and government has undertaken lot of scheme to subsidize on it. Presently there are about 2, 64,000 solar panels installed throughout the country.

Now, more than 3 lakh houses (.3m) of 465 upazilla of all the districts and 16 islands are getting the light of solar energy. The beneficiaries of this system are about 30 lacks (3m). 44 megawatt electricity is produced everyday from the solar projects in Bangladesh. In future Bangladesh Government wants to produce 20% of electricity from the solar energy.

Bio-Gas 

Biogas may be the most promising renewable energy resource. Presently there are about 50,000 households and village-level biogas plants in place throughout the country. There is a huge potential for expansion in rural areas.

There is prospect of producing 1,000MW electricity from Biogas and if the opportunity is utilized the growing shortage of electricity could be solved in this power-starved country. The government agency Infrastructure Development Company Limited sources said Bangladesh has 215,000 poultry farms and 15,000 cattle farms. Establishing biogas plants in these farms, electricity could be generated. So far 35,000 biogas plants have been established across the country and these plants are producing gas, which is being used for cooking purposes in the rural areas. At present 33 lack squire feet biogas is being produced in the country daily. The Government agency said they got eight core tons of cow dung in 2004.With this cow dung, 30 lack biogas plants could be run. Government has a target to establishing 60,000 biogas plants by 2012.

Wind Power

Wind power harnesses the power of the wind to propel the blades of wind turbines. 31 At the end of 2009, worldwide wind farm capacity was 157,900 MW, representing an increase of percent during the year. Germany, Spain, Denmark, Portugal, United States are leading wind power producer country.

Bangladesh generates a very small amount of electricity from this sector. Windmills are with capacity of 2 MW in operation in the coastal area of Bangladesh. The possibly of this type of power generation is low.

Nuclear Energy

Nuclear power station use nuclear fission to generate energy by the reaction of uranium-235 inside a nuclear reactor. Now a day it’s one of the major sources of electricity. At present in Bangladesh electricity generates from nuclear energy is 0%. Recently we signed an agreement with Russia to install our first nuclear plant at Rooppur in Pabna. The construction cost is initially being put at between US$1.5 billion and $2 billion in the final agreement The Rooppur nuclear power plant (RNPP) will eventually generate around 2,000 megawatts (MW) of electricity, with each of two proposed reactors having a capacity to generate 1,000 MW.

Coal as a source of energy

Coal is a valuable and plentiful natural global resource. Coal, a fossil fuel, is the largest source of energy for the generation of electricity, worldwide. Coal plays a vital role in electricity generation worldwide. Coal-fired power plants currently fuel 41% of global electricity.

Besides natural gas, Bangladesh has significant coal reserve. Coal reserves of about 3.3 billion tons comprising 5 deposits at depths of 118-1158 meters have been discovered so far in the north-western part of Bangladesh. The name of these deposits are-Barapukuria, Phulbari and Dighipara coal field in Dinajpur district, Khalashpir in Rangpur district and Jamalganj in Joypurhat district. Out of which 4 deposits (118-509 meters) are extractable at present. As an alternative fuel to natural gas, coal can be extensively used. The depth of Jamalganj coal deposit is 640-1158 meter with 1053 Million Tones in-situ coal reserve where production may not be viable by present day’s technology due to the depth of the deposits. Possibilities of extraction of Coal Bed Methane (CBM) need to be explored from this coal deposits. Government is actively reviewing law to be applicable for Exploration and Production of Coal Bed Methane. So far, only Barapukuria coal field is under production. Dinajpur Barapukuria coal fired power plant is our first coal based power plant which capacity is 250MW. Then some small power plant was made. Bangladesh has a bright future in coal based power generation if we remove the obstacle of this sector.

Coal fields of Bangladesh

Bangladesh is sleeping on coal mine bed located in the northern districts of Rangpur and Dinajpur, while facing a mounting energy crisis and relies on natural gas as the main source of energy, which is depleting at geometrical progression. In contrast, Bangladesh has proven reserve of 3.0 billion tonnes of low sulphur, low ash, high caloric value bituminous coal in five discovered coal mines – Phulbari, Barapukuria, Jamalganj, Dighipara and Khalsapir.

Bangladesh has 15 tcf (trillion cubic feet) of proven reserve of natural gas; the remaining 6 tcf reserve of natural gas may run out by 2015, if no discovery is made soon.  As against this, the coal reserves in five fields of Bangladesh are estimated at 3.0 billion tonnes equivalent to 67 tcf of gas, which can conveniently serve the energy needs of Bangladesh for 50 years.

Table Coal Reserves in Bangladesh

The depth of the discovered fields ranges between 119 – 506 metres and 150 – 240 metres in Barapukuria and Phulbari respectively. The depth of the largest field at Jamalganj ranges from 900 – 1000 metres.  The area covered by coal fields is rather limited and is about 70 – 80 square kilometres. A total of 1.73 million tonnes of coal has been extracted by underground method from Barapukuria up to December 2008. The present value of coal per tonne in international market is for steam coal US$ 65-115, coking coal US$ 250, metallurgic coke coal US$ 525. The total value of coal will be more than US$ 500 billion.

Barapukuria Coal Field

The Barapukuria coalfield is located at the Parbatipur Upazila of Dinajpur district, at a distance of about 50 km southeast of Dinajpur town. The coalfield has a proved area of about 5.25sq km. The estimated resource of the coalfield is 390 MT.

The government decided to establish an underground coal mine at Barapukuria. In 1993, the government entered into a contract with the Chinese government for technical and financial assistances for establishing the mine. The mine construction by the Chinese contractor started in 1996 and was originally scheduled to be completed by 2001. But this was delayed and finally commercial production started from September 2005.

However, the underground mining operation in Barapukuria has been facing many difficulties from the beginning of its development stage. In 1998, a sudden water inrush flooded the mine and forced to suspend mine development works for two years. The revised mine design reduced both mineable reserve and mine life. In fact, the existing geologic setup: the thick overlying water bearing Upper Dupi Tila  sequence, high jointed thick coal seam (36m) with numerous faults and joints made the situation difficult for smooth economic operation of the mine. The unfavorable underground mining environment with high temperature, very high humidity, and unidentified sources of hot water, spontaneous combustion and lethal gas emission made the situation dangerous and unhygienic for the mine workers. An incident of spontaneous combustion and emission of poisonous carbon monoxide gas led to suspend operation and sealing off a mining face with one of its longwall systems.

Phulbari Coal Field

The Phulbari coalfield was discovered in 1997 by BHP Minerals. The Phulbari coalfield is located about 10 km south of the Barapukuria coal field and in the vicinity of Phulbari township. The coalfield is conveniently located close to the new dual gauge rail line.

Subsequent to the discovery of Phulbari coalfield, BHP Minerals decided to withdraw from Bangladesh and transferred its Contract and existing licenses to another mining company Asia Energy Corporation (Bangladesh) Pty Ltd with the approval of the Government. In this regard, an Assignment Agreement was signed on 11 February 1998.  The pre feasibility study carried out in 2000 confirmed the economic viability of large scale open pit mine in Phulbari Basin. Asia Energy had undertaken a detailed feasibility study including extensive geological, hydro geological, environmental and social studies during the period 2004-05 and established an internationally accepted (JORC Standard) resource of 572 Mt of high quality thermal and metallurgical coal.

The mining area in the Phulbari Basin covers an area of eight kilometers (north-south) by three kilometers (east-west) with coal seam(s) varying between 15-70 meters thick at some 150-270 meters beneath the surface, with average combined thickness of 38 meters. The Phulbari coal is high volatile bituminous coal. It has low ash (average 15%) and low sulfur content (<1%) and therefore suitable for both power generation and for producing semi-soft coking coal.

Asia Energy submitted Scheme of Development on October 2005 to the Government with a plan to develop the Phulbari coal deposit by the open cut mining method. In 5 years three governments failed to either approve the scheme or reject it with technical justifications. Coal resources of  Phulbari remains unexplored.

The mine is estimated to produce 15 million tonnes of coal per year over 35 years of mine life. Asia Energy has also submitted proposal to setup up to 1000 MW mine mouth coal-fired power plant based on Phulbari coal. In addition to coal, the open pit mining method will allow economic extraction of other co-products like kaolin, clay, glass sand rock and aggregate, which are in high demand.

Jamalganj Coal Field

The Jamalganj coalfield is located in Joypurhat district in the vicinity of Jamalganj town and to the west of the north-south broad-gauge railway line. The coalfield was discovered in 1962 by the Geological Survey (of the then Pakistan) under the UN sponsored coal exploration program. Under the program 10 wells were drilled in the Jamaganj-Paharpur area of Joypurhat district. Coal seams were encountered in 9 wells within depth range of 640 to 1158 meter below the surface in Permian Gondwana rocks. The 9 bore holes that penetrated the coal seams are spread over an area having a maximum east-west distance of 12.5 km and a north-south distance of 4.8 km. The coal field has an estimated resource of 1053 Mt bituminous coal.

Following the discovery of the coalfield, several international consultants, were invited to conduct mine feasibility study. These include Fried Krupp Rohstoff (1966), Polwell Daffryn Technical Services (1969) and Robertson Research International (1976). Although rated technically feasible, the economic feasibility of mining Jamalganj coal could not be shown because of the unfavorable depth of coal seams. Eventually, the idea of mining coal from Jamalganj field was abandoned when a large coal deposit was discovered at much shallower depth of about 120 meter below the surface at Barapukuria basin in Dinajpur district. However, developing coal bed methane (CBM) in the Jamalganj coalfield has since been considered a potentially viable option.

 Khalashpir Coal Field

Khalashpir coalfield is located in Pirganj Upazila of Rangpur district, about 13 km west of Pirganj town. Khalashpir coalfield was discovered in 1989 by the Geological Survey of Bangladesh. The coalfield was delineated and defined on the basis of the four drill holes done during 1989-90. The coal was encountered at depths ranging from 257 to 482 meter below the surface in a Gondwana basin. Occurrence of coal has been proved in an area of about 2.52 sq km and a further extension of the basin is estimated. The Khalashpir coalfield has an estimated resource varying from 143-450 Mt.

Dighipara Coal Field

Dighipara coalfield is located in Dighupara Upazila of Rangpur district,  Dighipara coalfield was discovered in 1995 by the Geological Survey of Bangladesh. The coalfield was delineated and defined on the basis of the five drill holes. The coal was encountered at depths is 327meter below the surface. The Dighipara coalfield has an estimated resource of 200 Mt.

Coal mining methods

However, we failed to explore and exploit the natural resources to utilize these for economic development. We have miserably failed to cope up with the increasing energy demand of the country. We have age-old mining policy, mining act and mining regulations. We do not have any exploration and utilization strategy of gas reserve. We are yet to have a coal policy finalized. The Bureau of Mineral Development issued a license to BHP(Broken Hill Proprietary Company), Australia in 1994 for exploration of Phulbari Mine. The license was transferred to Asia Energy in 1997. Bangladesh media quoting responsible sources stated that Asia Energy is yet to obtain mining license. However, the mining could not proceed due to alleged lack of transparency in award of the license and unrest in the area triggered by a motivated group of left leaning intellectuals. The agitations lead to death of 6 protesters in police and paramilitary troops firing.Coal mining at Phulbari and other coal fields now hinges on the Coal Policy under consideration of the government. The Coal Policy is pending for quite some time due to disagreements on some issues, namely,

(a) Open pit versus underground mining

(b) Social environmental impact management

(c) Royalty etc. Government engaged committee having line professionals

Selection of mining methods depend on several things – geology of mine area, terrain condition, topography, soil condition and nature, depth, thickness and nature of coal seam, surface and subsurface soil condition.

One of the major challenges the energy sector is facing is to find out ways how to economically exploit its substantial high quality coal reserve .The predominantly mono fuel –Natural Gas dependent power generation is in limbo. The proven gas resource is widely believed to be exhausted in not too distant future. For confusion and panic set in by inexperienced ill motivated theoreticians and absence of strong political commitment government could not take decision of appropriate mining strategy to economically exploit coal resource. The deficit is widening. The ensuing summer will witness massive load shedding.

The just installed democratic government will face serious embarrassment for failures of incompetent last political and immediately past Care Taker Government. Of the 5 discovered ca coal mines the Jamalgonj coal is at greater depth which cannot be mined in traditional mining methods. Coal at Khalaspeer and Dighipara are also at relatively greater depth. Barapukuria and Phulbari coal are at relative shallower depth. The geology makes these ideal for open pit surface mining which is in practice in the following countries now.

Bangladesh which has limited capacity to purchase petroleum products from volatile world oil market cannot continue to keep its fortune buried underground forever. It cannot also remain confused triggered from myths and ill motivated propaganda of a vested group. The disadvantage is most of our innocent people as well as policy makers do not have much knowledge of mining. There is no scope of learning mining technology in Bangladesh also. During Pakistan days sons of well to do persons who could not get admissions in Ahshanullah Engineering College used to go to Lahore to study mining. This group of mining engineers worked in Gas sector in absence of mining activities in Bangladesh. They could neither become good miners nor good gas engineers. Rather for their control other professionals got frustrated and many left gas sectors. Many mining engineers created controversy in Gas Sector also. There were few outstanding mining engineers as well. But no all of them retired. But unfortunately none of them were included in drafting coal policy.

Bangladesh let a Chinese company start underground mining at Barapukuria. Many mining experts felt the existing geology can never make underground mining technically viable or economically feasible there. Still a vested group of BNP government from 1991-96 allowed to start Barapukuria mining under suppliers credit. Experts now feel that there were several juggleries in the project approval process. It now appears that proper risk assessments of Bapaukuria mining were not done. The possible and probable subsidence impacts were not anticipated and no actions were foreseen to address those impacts. Now after a more that one and a half decade of trouble tone mining with several major set backs at various stage mine subsidence impacts are now visible which may puts future of mining uncertain.

BHP Billiton, the leading Mining Company of the world was given mining lease at Phulabri where very thick seam bituminous coal is lying at shallow depth. At some stage of survey and assessment it transferred lease to Asia Energy Corporation. (AEC) UK.AEC carried out extensive survey, carried out some exploratory drillings, completed extensive Environment Impact Assessment studies. Then it submitted a comprehensive study to Government of Bangladesh in January 2005 after meeting all the contractual requirements. The development plan included surface mining methods. It included proper relocation and rehabilitation plan of the affected people. Bangladesh was due to approve to reject the development plan within the contractual time frame.

He engaged a  so called Energy Expert   to review the Phulbari mining matters. This gentleman stepped out of his assigned responsibility and agitated the people of Phulbari over AEC proposed open pit mining.BNP government should have done community consultations to pacify the situation. But a very arrogant Mahmud let situation go out of control .The local agitation led to unfortunate situation when some innocent misguided local people were killed.

The local situation was to be controlled by signing a compromise agreement by Mayor Rajshahi and MP. This irrelevant piece of paper was signed with a legally unrecognizable organisation. Now based on this the agitators are demanding to scrap AEC contract , banning open pit mining etc, etc & etc. Any sensible person will realize that such an agreement has no legal bearing in dealing with a contract signed between a sovereign government and an international company.

Any contract includes a termination clause. It requires one party to establish default of the other party with evidences. It also requires the party notifying default of the other party to give them to defend its position. If Bangladesh ventures to terminate the AEC contract then this will obviously go to arbitration. Bangladesh will invariably loose and will have to pay huge compensation.

Open pit mining
Open pit mining as defined in open encyclopaedia states, “Open pit mining, also known as opencast mining, open –cut mining, and strip mining, refers to a method of extracting rock or minerals from the earth by their removal from an open pit or borrow. Open –pit mines are used when deposits of commercially useful minerals or rock are found near the surfaces, that is where the overburden (surface material covering the valuable deposit) is relatively thin or the material of interest is structurally unsuitable for tunneling .For minerals that occur deep below the surface –where overburden is thick or minerals occurs as veins in hard rock – underground mining methods extract the valuable material.

Open pit mines are typically enlarged until either the mineral resources are exhausted, or an increasing ratio of overburden to ore makes further mining uneconomic. When this occurs, the exhausted mines are sometimes converted to landfills for disposal of solid wastes. However some form of water control is usually required to keep the mine pit from becoming a lake.

Open Cut mines are dug on benches, which describe vertical levels of the hole. These benches are usually on four meter to sixty meter intervals, depending on the size of the machinery that is being used. Many quarries do not use benches, as they are usually shallow.

Most walls of the pit are generally dug on an angle less than vertical, to prevent and minimize damage and danger from rock falls. This depends on how weathered the rocks are, and the type of rock, and also how many structural weaknesses occur within the rocks, such as a fault, shears, joints or foliations.

The walls are stepped. The inclined section of the wall is known as the batter, and the flat part of the step is known as the bench or perm. The steps in the walls help prevent rock falls continuing down the entire face of the wall. In some instances additional ground support is required and rock bolts, cable bolts and concrete are used. De-watering bores may be used to relieve water pressure by drilling horizontally into the wall, which is often enough to cause failures in the wall by itself.A haul road is situated at the side of the pit, forming a ramp up which trucks can drive, carrying ore and waste rock.

Waste rock is piled up at the surface, near the edge of the open cut. This is known as the waste dump. The waste dump is also tiered and stepped, to minimize degradation. Ore which has been processed is known as tailings, and is generally a slurry. This is pumped to a tailings dam or settling pond, where the water evaporates. Tailings dams can often be toxic due to the presence of unextracted sulfide minerals, some forms of toxic minerals in the gangue, and often cyanide which is used to treat gold ore via the cyanide leach process.
After mining finishes, the mine area must undergo rehabilitation. Waste dumps are contoured to flatten them out, to further stabilize them. If the ore contains sulfides it is usually covered with a layer of clay to prevent access of rain and oxygen from the air, which can oxidize the sulfides to produce sulfuric acid, a phenomenon known as acid mine drainage. This is then generally covered with soil, and vegetation is planted to help consolidate the material. Eventually this layer will erode, but it is generally hoped that the rate of leaching or acid will be slowed by the cover such that the environment can handle the load of acid and associated heavy metals. There are no long term studies on the success of these covers due to the relatively short time in which large scale open pit mining has existed. It may take hundreds to thousands of years for some waste dumps to become “acid neutral” and stop leaching to the environment. The dumps are usually fenced off to prevent livestock denuding them of vegetation. The open pit is then surrounded with a fence, to prevent access, and it generally eventually fills up with ground water. In arid areas it may not fill due to the deep groundwater levels.

Environmentalists in all countries oppose mining; oppose burning of coal. But nowhere they can ride over policy makers to keep mining suspended for years when the energy security is compromised by not adopting economic mining method as is the case in Bangladesh. In this context it will not be out of place to discuss almost a similar situation in Malaysia – a country having almost similar geographical, geological and environmental situation like Bangladesh.

Underground Coal mining

Underground coal gasification (UCG) is an industrial process, which converts coal into product gas. UCG is an in-situ gasification process carried out in non-mined coal seams using injection of oxidants, and bringing the product gas to surface through production wells drilled from the surface. The product gas could to be used as a chemical feedstock or as fuel for power generation. The technique can be applied to resources that are otherwise unprofitable or technically complicated to extract by traditional mining methods and it also offers an alternative to conventional coal mining methods for some resources.

Underground coal gasification converts coal to gas while still in the coal seam (in-situ). Gas is produced and extracted through wells drilled into the un-mined coal seam. Injection wells are used to supply the oxidants (air, oxygen, or steam) to ignite and fuel the underground combustion process. Separate production wells are used to bring the product gas to surface. The high pressure combustion is conducted at temperature of 700–900 °C (1,290–1,650 °F), but it may reach up to 1,500 °C (2,730 °F). The process decomposes coal and generates carbon dioxide (CO2), hydrogen (ḥ), carbon monoxide (CO) and small quantities of methane (CH4) and hydrogen sulfide(H2S). As the coal face burns and the immediate area is depleted, the oxidants injected are controlled by the operator

As coal varies considerably in its resistance to flow, depending on its age, composition and geological history, the natural permeability of the coal to transport the gas is generally not adequate. For high pressure break-up of the coal, hydro-fracturing, electric-linkage, and reverse combustion may be used in varying degrees.

Two methods are commercially available. One uses vertical wells and a method of reverse combustion to open internal pathways in the coal. The process was used in the Soviet Union and was later modified by Ergo Energy. It was tested in Chinchilla site in 1998–2003. Livermore developed another method that creates dedicated inseam boreholes, using drilling and completion technology adapted from oil and gas production. It has a movable injection point known as CRIP (controlled retraction injection point) and generally uses oxygen or enriched air for gasification.

According to the Commonwealth Scientific and Industrial Research Organisation the following coal seam characteristics are most suitable for the underground coal gasification:

  • Depth of 100–600 meters (330–2,000 ft)
  • Thickness more than 5 meters (16 ft)
  • Ash content less than 60%
  • Minimal discontinuities

There are a number of site specific technical factors which are important to the process. Coals with wide range of properties can be utilized, items of significance include

  • The geology of the coal seam must be continuous and preferably thicker than three meters.
  • The overburden should be more than 100m thick, relatively impermeable and with reasonable strength above the coal seam.
  • The water table preferably should be within 20m or from the ground surface to provide cavity water pressure to balance the oxidant injection pressure and limit product gas leak

While each of the above each of the above item is individually important, it is over an appraisal of many technical aspects of the site that govern sits suitability for development. Commercial matters like size of coal reserve and the market for the produced gas are also critical for the development of a project at a particular site.

Comparison between the methods

Bangladeshi policy makers may carry out some research on UCG .It is not very difficult to locate the real pioneers of UCG. Whether or not UCG can be applicable in any Bangladesh coalmine is subjected to extensive feasibility study by truly professional company of proven track record. It is too early to comment on suitability of Bangladeshi coal mines for UCG. Let Government find the most appropriate company from among handful companies involved in UCG in Australia, South Africa and Pakistan. Let there be authentic feasibility study. Minor companies can tell stories but they can do nothing practically. UCG is a highly sophisticated and sensitive technology. One of the early generation UCG pioneer Russian Canadian Mr Blinderman is now living in Canada. Bangladesh must not try amateur attempt to extract UCG from its mines as they did with Barapukuria coalmine pursuing inappropriate underground mining. If any of our mine qualify for UCG that must be established by experts of proven technology. But this must not bring any impediments to mining of coal from reserves which are suitable for traditional mining.

Professionals already mentioned time and again about applicability of Strip Mining [Open Pit] at Barapukuria and Phulbari. Many thinks a combination of Open pit and underground mining can work in Khalaspeer and Dighipara. Unfortunately detail feasibility study could only be carried out at Phulbari by internationally accredited consultants. . Even then policy makers could not take decision on Phulbari after 5 years of receipt of professional mining proposal. The in appropriate mining at Barapukuria has triggered disaster. The most suitable mine for strip mining is an opportunity lost. Barapukuria is proved to be a failed project yet triggered massive subsidence at very early stage of mining. It experienced all impacts of an failed underground long wall mining .Luckily there has been not many causalities so far.

For example:
The existence of the open-pit mine, in Mukah have proven to be a blessing to the Iban community because:
They benefitted directly from the land compensation given by the said mining company for rights to mine on their land. Evidence can be seen from the fact that many of the long houses locating on the Mukah Coalfield have utilised the money to upgrade their longhouses and to purchase other necessities to enjoy comfort of modern living.
Through employment received from the said mining company , the community can supplement their shifting cultivation income by the more consistent monthly wages earned working as mining crew.
A As they are expose to the usage of modern equipment , they are able to accelerate their assimilation into modern world of 21st century and this will augur well for the Iban community in general specially for the younger generation.

The open cut mining project in Mukah have brought substantial benefits to the local community and the State of Srawak, through such contribution as Royalties to the sate for extraction of coal, a better standard of living for the local community through direct and indirect employment and a general increase in business for the local businesses in Mukah Division.

There seems to be lot of similarities of Mukah region of Malaysia with our Phulbari, Barapukuria region. We can definitely try to learn lessons and try to replicate the good works. Malaysia is not very far from Bangladesh. Government can organize sending its officials, mining professionals, environmentalists to eye witness the mining activities, and management of social and environmental impacts of open pit mining. It is not a rocket science. We talk about digital Bangladesh. We still do not know what open pit mining is. Silly and ridiculous to keep our fortune buried while nation continues to suffer from serious energy crisis

COAL IN PROUCTION OF ELECTRICITY

Modern life is unimaginable without electricity. It lights houses, buildings, streets, provides domestic and industrial heat, and powers most equipment used in homes, offices and machinery in factories. Improving access to electricity worldwide is critical to alleviating poverty.

How is Coal Converted to Electricity

Steam coal also known as thermal coal is used in power stations to generate electricity.

Coal is first milled to a fine powder which increases the surface area and allows it to burn more quickly. In these pulverized coal combustion (PCC) systems the powdered coal is blown into the combustion chamber of a boiler where it is burnt at high temperature (see diagram below). The hot gases and heat energy produced converts water – in tubes lining the boiler – into steam.

The high pressure steam is passed into a turbine containing thousands of propeller-like blades. The steam pushes these blades causing the turbine shaft to rotate at high speed. A generator is mounted at one end of the turbine shaft and consists of carefully wound wire coils. Electricity is generated when these are rapidly rotated in a strong magnetic field. After passing through the turbine the steam is condensed and returned to the boiler to be heated once again.

The electricity generated is transformed into the higher voltages (up to 400,000 volts) used for economic efficient transmission via power line grids. When it nears the point of consumption, such as our homes the electricity is transformed down to the safer 100-250 voltage systems used in the domestic market.

 Electricity sector in Bangladesh

Bangladesh’s energy infrastructure is quite small insufficient and poorly managed. The per capita energy consumption in Bangladesh is one of the lowest (136 kWH) in the world. Noncommercial energy sources such as wood, animal wastes, and crop residues are estimated to account for over half of the country’s energy consumption. Bangladesh has small reserves of oil and coal but very large natural gas resources. Commercial energy consumption is mostly natural gas (around 66%) followed by oil, hydropower and coal.

Electricity is the major source of power for country’s most of the economic activities. Bangladesh’s installed electric generation capacity was 4.7 GW in 2009 only three-fourth of which is considered to be ‘available’. Only 40% of the population has access to electricity with a per capita availability of 136 kWh per annum. Problems in the Bangladesh’s electric power sector include corruption in administration, high system losses, delays in completion of new plants, low plant efficiencies, erratic power supply, electricity theft, blackouts, and shortages of funds for power plant maintenance. Overall the country’s generation plants have been unable to meet system demand over the past decade.

In generating and distributing electricity the failure to adequately manage the load leads to extensive load shedding which results in severe disruption in the industrial production and other economic activities. A recent survey reveals that power outages result in a loss of industrial output worth $1 billion a year which reduces the GDP growth by about half a percentage point in Bangladesh. A major hurdle in efficiently delivering power is caused by the inefficient distribution system. It is estimated that the total transmission and distribution losses in Bangladesh amount to one-third of the total generation the value of which is equal to US $247 million per year.

Developing Thar Coal  In Bangladesh

Coal is the cheapest source of energy consumed the world over playing a pivotal role in the generation of power for the smooth operation of industries. Thar coal is said to be one of the largest coal reserves in the world situated in Tharparkar Sindh. Coal is the most important source used for generating electricity in most of the developed and developing countries.

The authentic statistics of the World Coal Institute, London published in 2006 say that the share of the coal in the production of power in the United States is about 52.2 per cent while China produces 77.5 per cent of its total electricity by using coal.

The share of coal in the production of electricity is 92.2 per cent in South Africa. Our closest neighbor (India) meets approximately 70 per cent of its power needs through coal whereas we are using just five per cent of our coal for energy production.

Several MoUs were signed between the past government of the PPP and multinational exploration companies which even invested and began working on the infrastructural development of the area but after the removal of the PPP government Mian Nawaz Sharif scrapped those coal development projects on political grounds.

During the Musharraf regime a Chinese company was invited to invest in the project aimed at generating 600 MW of electricity but due to unfriendly attitude of Wapda and Nepra the Chinese company had to quit.

Now when we are facing the worst-ever energy crisis we must start developing Thar coalfields. The Sindh Coal and Energy Board has been established under the chairmanship of the Sindh Chief Minister which has still to show its performance. To end the energy crisis once for all development of Thar coal is the most feasible option available.

Power Generation In Bangladesh

In November 2010 Reuters reported that the Bangladesh Power Development Board (BPDB) had announced the aim of generate 9,000 megawatts of electricity by 2015. The country currently produces approximately 4,000 MW of electricity a day “against peak hourly demand of over 6,000 MW.

The BPDB called for tender bids on a number of new power plants including two coal-fired plants. One is a 300MW coal plant to be built near Chittagong port. The tender closes at the end of January 2011. The board has also sought tenders for a 650MW coal plant to be built near Mawa. Both projects are proposed to be constructed on a build own and operate basis for 25 years. Reuters reported that BPDB officials stated that in the near future thwy would call for bids for 10 new power plants to add another 4,000 megawatts of electricity to the national grid.

Local coal for power generation

THE Power Development Board (PDB) has reportedly proposed last week to form a public limited company to install coal-based power plants in future. According to PDB sources four mega coal-based power plants having capacity of producing 500 megawatt of electricity each would be established under the supervision of the proposed company by 2014. Several companies have already expressed interest to establish the plants under Public Private Partnership.

The country suffers from a serious shortage of electricity. According to sources the total generation comes to 3,200mw of electricity against the demand for 4,600mw. The crisis has reached a point of seriously hampering production in mills and factories. Several power plants are reportedly producing electricity less than their capacities. Some others have stopped production due to short supply of gas that fuels 80 percent of power generation. According to a projection, the country will need about 10,000mw and 14,000mw electricity by 2015 and 2020 respectively. But except for limited reserves of gas there is only coal to fuel power plants. So the proposal for installation of coal-based power plants is a step in the right direction.

It has been reported that PDB would use imported coal to run the proposed plants. Bangladesh has a proven reserve of 2,086 million tons of high quality coal. According to experts this coal is enough to generate 5,000mw of electricity for up to 90 years. It will also save about US$500 million that the country spends annually to import coal. Petrobangla had in June even proposed to export two lakh tons of coal from Barapukuria due to storage problem. Then what is the reason behind the idea of using imported coal instead of the local coal. The country should go for early extraction of its own coal resource.

New company to be set up to increase coal-based power generation

The government will form a new company styled ‘Bangladesh Coal Power Company’ to set up the planned coal-fired power plants and increase the country’s electricity generation by using the mineral officials. The power ministry has already decided to create the company after enlisting it with the Registrar of the Joint Stock Companies and Firms (RJSCF).

The proposed new company will boost electricity generation from coal which is abundant in northern Bangladesh. Immediately after formation of the company it will be engaged to facilitate setting up four coal-fired power plants to generate 2,000 megawatts (mw) of electricity each having generation capacity of 500 mw.

The power ministry has taken up the program for installing four coal-fired
power plants under the new concept of the private public partnership (PPP) where the government will own only a fraction of its shares for offering land and infrastructure. It will require around US$ 3.0 billion (Tk 210 billion) for setting up these coal plants. When contacted Chairman of Bangladesh Power Development Board (BPDB) ASM Alamgir Kabir said the board is now working on the formation of the new company to augment electricity generation from the coal-fired power plants.

The company will be constituted with the efficient people where some BPDB officials will also get appointment. The BPDB has already initiated the groundbreaking work and is now selecting sites for setting up the plants. It has primarily selected – Karnaphuli river bank in Chittagong near Mongla seaport in Khulna, Jazira on the bank of Padma and at Meghnaghat on the bank of Meghna – for setting up the plants for smooth transportation of coal.

Initially the planned power plants will be run with the imported coal from the global markets including the key exporting countries like Indonesia, Australia and India. The existing infrastructure like drafting in waterways and expansion of railway tracks will be required for efficient coal transportation, said a power ministry official. All the four proposed coal-fired power plants along with some independent power producer (IPP) projects will be put on offer during the road shows in three key important locations – New York, London and Singapore – in December next.

The major task of the proposed company will be to arrange finance necessary coal supply and develop required infrastructure. Despite having enormous coal reserves of around 3.0 billion tones in five different mines the country’s coal-fired power generation is limited to only one plant at Barapukuria having the generation capacity of 250 mw. Even the Barapukuria plant is struggling to generate electricity to half of its installed capacity.

The country is waiting for adoption of a national coal policy to start coal extraction from the mineral-rich northern region. The country’s overall electricity generation is now hovering around 3,800mw against the peak hour demand for over 5,500mw.

Bangladesh seeks bids for 300 MW coal-fired plant

Bangladesh has invited bids for a 300-megawatt coal-fired power plant to be set up on a build, own and operate basis (BOO) for 25 years. The tender for the plant to be built near the country’s main Chittagong port 300 km (188 miles) southeast of the capital will close on Jan. 31, next year. The bids have been invited as part of a government initiative to generate 9,000 MW of electricity by 2015.The BPDB is the regulator for power generation and distribution in the country where the gap between demand and generation has been growing.

Bids for a short-list of viable firms have also been invited for another 650 MW coal-fired plant to be set up at Mawa 50 km (31 miles) east of the capital, Dhaka also on a BOO basis and for 25 years. The bids for the short-list will close on Dec. 30.Energy-starved Bangladesh which faces a deficit of 2,000 MW of power aims to set up a number of power plants to cover the shortfall as quick as possible.

BPDB awarded a $114 deal to a Chinese firm — China National Machinery Import and Export Corporation to set up a 150 MW power plant in northern Sirajganj by May 2012. BPDB in the recent months signed deals with several foreign and local firms to set up plants or to buy electricity from their rental plants. Britain’s Aggreko PLC and seven other local firms were given deals to supply some 870 megawatts of power to the national grid for five years starting later this year.

Aggreko has already started generating 200 MW from two fuel oil-fired rented generator from August at $0.21 per kilowatt-hour. The British firm also won another deal last month to supply more 150 MW to the Bangladesh national grid from its two small gas-fired plant from February for three years at $0.07 per kilowatt-hour. Bangladesh will soon seek bids for 10 new power plants to add another 4,000 megawatts of electricity to the national grid.

US firms keen to invest in coal sector

American companies are keen to invest in Bangladesh’s coal sector. The US envoy apprised him that American energy companies are interested to help Bangladesh in developing energy sector. They particularly want to invest in coal mining after finalization of the coal policy by the government.

Moriarty noted that the United States would provide necessary assistance for the victims if Bangladesh side seek any help.A number of US companies including oil major Chevron have been operating in the country’s energy and power sector. But this is the first time it was learned that US energy companies are also interested in the coal mines.

Bangladesh has about five coal mines in the country’s northern region, having a total coal deposit of 2.5 billion tons.

Coal  In  Electrical Power System

World  coal  fired  power  plant  capacity  will  grow  from  1,759,000  MW  in  2010  to  2,384,000  MW  in  2020.Some  80,000  MW  will  be  replaced.So  there  will  be  705,000  MW  of  new  coal  fired  boilers  sales  will  average  70,000  MW.

Coal  fired  power  plants  generate  approximately  56%  of the U.S  electricity.A  healthy  economy  requires  the  effective  utilization  of  the  existing  infrastructure  as  new technologies  are  introduced.Coal  plays  a  vital  role  in  electricity  generation worldwide.Coal  fired  power  plant  currently  fuel  41%  of  global  electricity.In  some  countries  coal  fuels  a  higher  percentage  of  electricity.Germany  is  one  of  the  major  nation  who  converts  coal  in  electricity  generation.In  2008  the  gross  electric  power  generation  in  Germany  totalled  639  billion  KWH.A  major  proportion  of  the  electricity  supply  is  based  on  lignite (23.5%), nuclear  energy (23.3%)  and  hard  coal (20.1%).Natural  gas  has  a  share  of  13%  renewables (wind,water,biomass)  account  for  15.1%.

Table Coal  In  Electricity  Generation Outside Bangladesh

Name  Of  The  Country Total  Generation
                 South  Africa                                 93%
                 Australia                                77%
                 USA                                49%
                 India                                69%
                 Germany                                46%

Kogan  creek  power  station  of  Australia  has  a  capacity  of  7636 MW  and  it  produces  2.46%  of  electricity.Hassyan  power  station  of  Arab  Emirates  has  a  capacity  of  9000 MW  and  it  produces  1.35%  of  electricity.Altbach  power  station  of  Germany  has  a  capacity  of  1200 MW  and  it  produces  0.18%  of  electricity.Cottam  power  station  of  United  Kingdom  has  a  capacity  of  2000 MW  and  it  produces  3.5%  of  electricity.

Improvements  continue  to  be  made  in  conventional  power  station  design  and  new  combustion  technologies  are  being  developed.These  allow  more  electricity  to  be  produced  from  less  coal  known  as  improving  the  thermal  efficiency  of  the  electrical  power  station.Coal  will  continue  to  be  a  valued  resource  with  over  100 GW  of  new  coal  plants  projected  by  2020.Advanced  technology  is  required  to  meet  economic  and  environmental  goals.It  also  maintaining  diversity  manufacturing  capabilities  also  mention  environmental  goals as  its  security  concern.

Carbon Dioxide  Emission  Factors  For  Coal Across The World

Coal  is  an  important  source  of  energy  across  the  world  and  the  whole  world  depends on  this  fossil  fuel  for  electricity  generation  is  growing.The  combustion  of  coal  also  adds  a  significant  amount  of  carbon  dioxide  to  the  atmosphere  per  unit  of  heat  energy.In  modern  days  a  growing  concern  over  the  possible  consequences  of  global  warming which may  be  caused  in  part  by  increases  in  atmospheric  carbon  dioxide (a  major  greenhouse  gas)  and  also  because  of  the  need  for  accurate  estimates  of  carbon  dioxide  emissions .The  Energy  Information  Administration (EIA)  has  a  developed  factors  for  estimating  the  amount  of  carbon  dioxide  emitted  as  a  result  of  coal  consumption. EIA’s  emission  factors  will  improve  the  accuracy  of  estimates  of  carbon  dioxide  emissions  because  they  reflect  the  difference  in  the  ratio  of  carbon  to  heat  content  by  rank  of  coal  and  state  of  origin.

Two types of carbon dioxide emission factors have been developed. First are basic emission factors covering the various coal ranks by State of origin. These basic emission factors are considered as “fixed” for the foreseeable future until better data become available. Second are emission factors for use in estimating carbon dioxide emissions from coal consumption by State with consuming-sector detail. These emission factors are based on the mix of coal consumed and the basic emission factors by coal rank and State of origin. These emission factors are subject to change over time, reflecting changes in the mix of coal consumed.

EIA’s emission factors will not only enable coal-generated carbon dioxide emissions to be estimated more accurately than before but they will also provide consistency in estimates. Energy and environmental analysts will find EIA’s emission factors useful for analyzing and monitoring carbon dioxide emissions from coal combustion, whether they are estimated by the State of origin of the coal, consuming State, or consuming sector.

West of the Mississippi River the emission factors for bituminous coal range from more than 201 pounds of carbon dioxide per million Btu in Missouri, Iowa, and Nevada to more than 209 in Arizona, Arkansas, and Montana. About 16 percent of the 1992 coal output west of the Mississippi was bituminous coal with production chiefly from Utah, Arizona, Colorado and New Mexico.

Sub bituminous coal is the predominant rank of coal produced west of the Mississippi River accounting for 62 percent of the region’s total coal output in 1992. Sub bituminous coal in Wyoming’s Powder River Basin the principal source of this rank of coal, has an emission factor of 212.7 pounds of carbon dioxide per million Btu. This is the same as for sub bituminous coal in Colorado, but slightly below that in Montana. The lowest emission factor for sub bituminous coal is in Utah (207.1) and the highest is in Alaska (214.0).

 Coal Costs

On the heels of President Obama’s speech supporting clean coal it doesn’t seem that this energy source is leaving anytime soon. But while advocates often tout the inexpensiveness of coal a new study reveals that the substance may be costing the U.S. up to $500 billion per year.

Harvard professor and Huffington Post contributor Paul Epstein( M.D., M.P.H.) has just announced the release of a new study in the Annals of the New York Academy of Sciences entitled “Full Cost Accounting For the Life Cycle Of Coal.”

According to Tree Hugger Epstein’s study is considered one of the first to examine the costs of coal in its entirety – from extraction to combustion. So how did Epstein reach the astronomical number of $500 billion/yr.

First, public health costs. In Appalachian communities alone health care, deaths, and injuries from coal mining and transporting cost $74 billion per year. Beyond Appalachia, the health costs of cancer, lung disease, and respiratory illnesses related to pollutant emissions totals $187.5 billion per year. According to Climate Progress, processing coal releases heavy metal toxins and carcinogens which in turn may lead to long-term health problems. The American Lung Association reports on a study finding that coal-powered electricity caused over 13,000 premature deaths in 2010.

Beyond health problems add the cost of coal’s effect on land use energy consumption and food prices plus the cost of toxic waste spills and cleanup… $500 billion. The public is unfairly paying for the impacts of coal use. Accounting for these ‘hidden costs’ doubles to triples the price of electricity from coal per kWh, making wind, solar, and other renewable very economically competitive.

According to Epstein, we must focus more on green city planning. Most importantly, “We need to phase out coal rapidly.”

Tapping Coal For Clean And Low-cost electricity In Bangladesh

Australian firm proposes to generate 400MW power from Bangladesh’s unmineable coal by 2015. An Australian company with expertise in underground coal gasification (UCG) technology has proposed to produce 400 megawatts of clean coal power from Bangladesh’s unmineable coal within five years at a very low cost.

Making a presentation to Petrobangla  Mitchell Group of Australia said it could undertake a pilot project at its own cost in the deeper part of Barapukuria coal mine or in Jamalganj.

The first phase delivery of 10 to 40 MW power from the pilot project is possible within two years — 2011-12. By 2015, the company will be able to deliver 400 MW power.

Sources present at the presentation said it is very lucrative as power generated from such a plant will be as cheap as that produced by using gas. A part of Barapukuria is presently unmineable by using open pit or underground mining methods as coal rests at a depth of 500 metres.

On the other hand the coal deposit in Jamalganj is by far the biggest one discovered in the country. Jamalganj has more than one billion tones of coal. Unfortunately the deposit rests between 600 and 1,100 metres below the surface making it inaccessible using conventional mining methods.

The Costs of Generating Electricity

• Coal plant

• Pulverized fuel (PF) steam plant.

• Circulating fluidized-bed combustion (CFBC) plant.

• Integrated gasification combined-cycle (IGCC) plant.

• Gas plant.

• Open-cycle gas turbine (OCGT) plant.

• Combined-cycle gas turbine (CCGT) plant.

• Nuclear fission plant.

• Biomass (poultry litter)

• Bubbling fluidized-bed combustion (BFBC) plant;

• Wind turbines

The cost of generating electricity, as defined within the scope of this study, is expressed in terms of a unit cost (pence per kWh) delivered at the boundary of the power station site. This cost value, therefore, includes the capital cost1 of the generating plant and equipment; the cost of fuel burned (if applicable); and the cost of operating and maintaining the plant in keeping with UK best practices. Within the study, however, the ‘cost of generating electricity’ is deemed to refer to that of providing a dependable (or ‘firm’) supply. For intermittent2 sources of generation, such as wind, an additional amount has been included for the provision of adequate standby generation.

Comparing Per Kilowatt-Hour Cost Estimates for Multiple Types of Energy Production

Hydroelectric is the most cost effective at $0.03 per kWh. Hydroelectric production is naturally limited by the number of feasible geographic locations and the huge environmental infringement caused by the construction of a dam. Nuclear and coal are tied at $0.04 per kWh. This comes as a bit of a surprise because coal is typically regarded as the cheapest form of energy production. Another surprise is that wind power ($0.08 per kWh) came in slightly cheaper than natural gas ($0.10 per kWh). Solar power was by far the most expensive at $0.22 per kWh—and that only represents construction costs because I could not find reliable data on production costs. Also, there is a higher degree of uncertainty in cost with wind and solar energy due to poor and varying

data regarding the useful life of the facilities and their capacity factors. For this analysis the average of the data points are used in the calculations.

Table  Extrapolation of Results

Energy Source % of Total Cost per kWh Weighted Avg Cost
Nuclear 19.7% $0.04 $0.008
Hydro 6.1% $0.03 $0.002
Coal 48.7% $0.04 $0.022
Natural Gas 21.4% $0.10 $0.022
Petroleum 1.1% $0.10 $0.001
Other Renewables 3.0% $0.15 $0.005
100% $0.059

Least-Cost Analysis of Bangladesh

About 85% of electricity in Bangladesh is produced from gas-based power plants. Coal,

Hydropower, heavy fuel oil (HFO) and diesel are the other sources of energy for power generation. Inadequate investment in upstream gas field development in recent years has resulted in a shortage of gas for the industrial sector and for electricity generation. This has constrained power generation with electricity utilities resorting to load shedding while industrial consumers have been using captive generation facilities that require diesel. As an immediate measure to reduce gas shortage the government has decided not to provide assured gas supply to a number of new power projects and has asked promoters to develop these projects on a dual fuel model (to be run on diesel or HFO).

Table indicates the cost of power generation using various fuels in Bangladesh:

Fuel Source Economic Generation Cost Per Unit Tk/kWh
Gas 4.2
Coal (local) 3.7
Coal (Imported) 5.4
HFO 12.1
Diesel 25.2
Hydropower 1.4

Bangladesh has sizable coal reserves in the north-west region, currently only one coal-based power plant is operating and it has been facing fuel shortages given constraints in coal production. The development of domestic coalfields will take time and will require significant investment. Imported coal-based power generally costs about Tk 5.4/kwh ($0.077) at current coal prices. In the current situation, power imports fromIndia3 are expected to be the most feasible least-cost way of overcoming existing power shortages in Bangladesh.

Cost of Barapukuria Coal Mine Project

Total Cost :                                          US$ 197million

US$:                                                    172 million in F.C.

US$:                                                     25 million in L.C.

Expected annual production:               1.2 million tons

Market price:                                       US$ 90 million

Annual production cost:                      US$ 40.8 million

Foreign currency worth:                      US$ 45 million will be saved per annum

64 years will be required to extract     300 million tons of coal at the above rate

The discovery of such huge deposits of coal and hard rock is a blessing for Bangladesh and proper development of these resources will open a new era for the country to enter the industrial world. In the modern world the sustainable economic conditions of any nation depend on how developed that country’s industrial is especially in the field of mineral resources. So minerals based industries are an important factor for accelerating the economic growth of a country. Now Bangladesh has an opportunity to build up mineral-based industries as she has sufficient mineral resources on which industries can develop. Full-capacity exploitation of these resources will create thousands of new jobs at the mine sites and later on at industrial sites which will help to alleviate the country’s poverty by providing jobs. All these together will accelerate the country’s economic development. It may be concluded that proper development and utilization of these resources will help us to save a considerable amount of foreign currency and will contribute a great deal to the national economy and reshape our socio-economic infrastructure.

Merits of coal fired power plant

1.         Coal is a stable energy source

2.         Coal is a key source of power generation

3.         High efficiency

4.         Low cost

5.         Low maintenance

Looking at other countries, coal makes up 50% of power generation in the USA, the largest consumer of energy, and 80% in China, where rapid growth in energy consumption is forecast. As coal accounts for 41% of the world’s power generation, it will continue to play a major role for the foreseeable future.

Emissions to air

The principal emissions from burning coal are carbon dioxide (CO2), sulphur dioxide (SO2), oxides of nitrogen (NOX), hydrogen chloride (HCl), and particulates (dust). Our generating units have all been retrofitted with Flue Gas Desulphurization (FGD) equipment which removes at least 90% of SO2 and HCl emissions before the flue gas is released via the chimney into the atmosphere.

We maintain investment in our emissions abatement equipment and consider this to be a high priority. Our FGD plant already complies with known future SO2 emissions limits to 2016. In 2008 we completed a programme to retrofit all units with low NOX technology – Boosted Over Fire Air systems – in order to ensure compliance with the NOX requirements of the Large Combustion Plant Directive (LCPD) which were strengthened in 2008.

Discharges to water

Procedures are in place to ensure that all discharges and drainage to water are monitored and treated where necessary to meet our discharge consent limits. There are a number of sources of discharge and drainage as part of the electricity generation process, including the cooling water used to cool the condensers, which as part of the steam cycle condense steam to water after it leaves the turbines and before returning to the boilers. Cooling water is abstracted mainly from the River Ouse and boiler feed water originates from two boreholes on site. Approximately half of the water is returned to the River Ouse at a few degrees warmer than the river water.

The FGD process produces effluent water which is treated in a specially designed plant before it is discharged to the river, and there is also drainage from the main plant, coal plant and roads.

 Disposals to land

When coal is burnt, ash is left as a residue. The finer particles of ash, pulverised fuel ash (PFA,) are collected from the flue gas by electrostatic precipitators; the heavier ash, furnace bottom ash (FBA) falls to the bottom of the boiler. The majority of ash is sold to the construction industry with the remainder sent for landfill at the power station’s adjacent Barlow Mound ash disposal site, which over time has been developed into farmland, woodland and wetland features providing a haven to many species of wildlife and birdlife.

We pay landfill tax on the PFA disposed of to the Barlow Mound. Through the Landfill Tax Credit Scheme, we are able to claim a tax credit against our donations to recognised Environmental Bodies. We have worked with Groundwork Selby since 2001 on projects designed to help mitigate the effects of landfill upon our local community.

 Environmental impacts of coal power

Burning coal is a leading cause of smog, acid rain, global warming, and air toxics. In an average year, a typical coal plant generates:

  1. 3,700,000 tons of carbon dioxide (CO2), the primary human cause of global warming–as much carbon dioxide as cutting down 161 million trees.
  2. 10,000 tons of sulfur dioxide (SO2), which causes acid rain that damages forests, lakes, and buildings, and forms small airborne particles that can penetrate deep into lungs.
  3. 500 tons of small airborne particles, which can cause chronic bronchitis, aggravated asthma, and premature death, as well as haze obstructing visibility.
  4. 10,200 tons of nitrogen oxide (NOx), as much as would be emitted by half a million late-model cars. NOx leads to formation of ozone (smog) which inflames the lungs, burning through lung tissue making people more susceptible to respiratory illness.

5.   720 tons of carbon monoxide (CO), which causes headaches and place additional stress on people with heart disease.

6.   220 tons of hydrocarbons, volatile organic compounds (VOC), which form ozone.

7.   170 pounds of mercury, where just 1/70th of a teaspoon deposited on a 25-acre lake can make the fish unsafe to eat.

8.   225 pounds of arsenic, which will cause cancer in one out of 100 people who drink water

Background

Geological Survey of Bangladesh (GSB) discovered presence of extensive coal reserve at relatively shallow depth in April 1985 in Barapukuria under Parbatipur-Upazilla of Dinajpur. GSB undertook further investigation in 1986 and 1987, involving more detailed gravimetric, magnetic and geophysical surveys to confirm the presence of approximately 303 million tones of high quality coal in six horizons over an area of 6.68 square kilometers. Subsequently, Bangladesh oil, Gas and Mineral Corporation (Petrobangla) with the assistance of Overseas Development Administration (ODA), UK concluded a detailed Techno- economic feasibility study by engaging M/S War dell Armstrong, UK in May 1991. The Major findings were as under

Reserve of Coal                          : 390 Million tones
Depth of coal                              : 118-509 meter.
Nos. of coal layer                        : 6
Average thickness of coal Seam : 36 m (6th Seam)
Composition of coal                    : Ash12.4%, Sulphur 0.53%, Noisture 10%
Rank of coal                                : Bituminous (high volatile).
Calorific value of coal                  : 25.68 MJ/KG (11040 BTU/Ib.)
Yearly Production                        : 1 million tones.
Coal extraction method                : Multi- Slice Long wall.

During development of Barapukuria Coal Mine as well as load testing/trial run, coal as obtained from the mine, on Chemical Analysis, confirmed composition of coal, Rank of coal and Calorific value of coal as predicted.

Objective

The Mine would produce 1 million tones of coal per annum when commercial production will commence out of which 65% will be used in 250 MW coal fired power station and remaining 35% will be used in brick fields and other domestic purposes.

Project implementation

M/s China National Machinery Import and Export Corporation (CMC) as lead partner of Consortium proposed supplier’s credit for the implementation of Barapukuria Coal Mine Project. The Project Concept Paper (PCP) was approved by ECNEC on 11th March 1992 and Project Proforma was approve by DPEC on 21st April 1993 at a total estimated cost of Tk.8873.55 Million including foreign exchange component of Tk.4868.76 million .The contract between M/S China National Machinery Import and Export Corporation (CMC) as lead partner of Consortium and Petrobangla was signed at the total lump-sum amount of US $ 194.91 million including supplier’s credit amounting to US$ 109.235 million on 7th February 1994. CMC commenced physical works on 1st June 1996 for the implementation of Barapukuria Coal Mine Project. As per contract the scheduled completion date was June 2001. On completion of installation works of two shafts, when development works of Pit Bottom were in progress underground mine inundated due to on rush of water. Consequently underground development works on mine was suspended for about 30(thirty) months.

This was necessitated to carry out additional geological & hydro-geological investigation in order to acquire additional date based on which CMC had to modify earlier approved mine design/layout. The underground mine development works restarted from October 2000. The PP was revised on the basis of modified mine design/layout and approved by ECNEC on 15th August 2004 at the estimated cost of Tk. 14311.27 million (Equivalent to US $ 251.08 Million). The project was scheduled for completion by December 2004 as per revised PP. The original Contract was amended by contract amendment keeping the original contract value unchanged with re- appropriation of item – wise costs. As per the revised schedule the completion period was fixed at 20th October 2004.

Management and production  contract

After completion of construction of Barapukuria coal mine on 31st may 2005, a Production Management and Maintenance (M&P) contract was signed with China National Machinery Import and Export Corporation (CMC) led consortium with Xuzhou Coal Mining Group Company Limited (XMC) on 4th June, 2005 for a period of 71 months to produce 4.75 million metric ton of coal from the 1st slice of underground mine at a total cost of USD 82.30 million. As per the terms of contract, CMC already paid Performance Security Guarantee (10% of total contract price) and Down Payment Guarantee (10% of total contract) for effecting the Contract, BCMCL paid Down Payment of local currency portion (10%) on 08-09-2005 and foreign currency portion (10%) on 15-11-2005. Since the M&P contract is fully effective, CMC-XMC produced coal from the Long Wall Face No. 1106 and 1101.

Present status                                                                                                                                                                   

Two Long wall Faces were constructed and two sets of Face Equipment were provided under the Construction Contract. One Long wall Face (1110) with incomplete production along with a set of Face Equipment had to be sealed off due to gas emission. To reopen 1110 Long wall Face, preparation work for Nitrogen Injection has been taken by CMC.

With only one set of Long wall Face Equipment available, the mine started its production from 1109 Long wall Face since March 2007. Production from this face started on 7 March 2007 after a gap of 6 months due to the following reasons:

I. 1109 Long wall Face development work delayed due to the fact of encountering unexpected geological and environmental problems. 176 meters excavated roadway had to be abandoned due to large roof fall and hot strata water ingress. 1109 Face required a redesign.

II. Installation and commissioning of Long wall equipment were delayed due to non availability of materials and spares needed importing from China.

Production from this Face is adversely affected by the following reasons:

a) Due to geological condition of the coal seam, Long wall Face open off cut developed inclined at an angle of 220-230. Equipment like heavy Hydraulic Powered Roof Support (HPRS) set on this inclined floor has great tendency to slip and tilt downward.

b) Adverse strata condition. Coal is friable and prone to caving.

c) Adverse environmental conditions. High temperature (390 Celsius) and humidity (100%) made the working condition difficult.

d) Relatively high strata water inflow washing down the floor of Long wall Face and causing instability to the HPRS.

e) Miners are getting fainted, heat stroke, and sick due to adverse environment.

Having adverse condition and lot of constrains, CMC successfully started the recovery work of 1110 Longwall Face from 18 August 2007.

Hardgrove Grindability Index (HGI)

Coal grind ability indicates the ease for grinding coal to power.The bigger of grind ability index, the easier to be grinded. Hard grove Grind ability Indices indicate that the coal is moderately hard, but not unusually so for Gondwana coal .

Chemical Properties (Proximate Analysis)

The Proximate analyses of coal samples have been done by War dell 1991. Average results of chemical analysis of Barapukuria Coal, Dianjpur, Bangladesh is given below.

Table Proximate Analysis of Design Coal Sample

SeamVI

Zone

Approzimate Thickness (m) Estimated Coal Quality (At 10% Moisture)
Rang Mean Ash(%) VolatileMetter

(%)

FixedCarbon

(%)

TotalSulphur

(%)

MJ/Kg Btu/Ib
B 3.7-6.5 5.4 9.0 29.9 51.1 0.61 26.81 11525
C 3.2-5.3 4.3 16.2 28.2 45.6 0.58 24.27 10435
D 3.1-4.3 3.9 10.8 30.2 49.0 0.57 26.33 11320
E 3.5-7.2 4.9 13.3 29.3 47.4 0.54 25.39 10915
G 4.2-7.5 5.5 16.9 26.5 46.6 0.56 23.74 10205

Ultimate Analysis

Elementary Analysis of coal samples of seam VI of GDH 38 has been done by GSB. The results of analysis are given in the Table 3, 4 & 5.

Table Elementary Analysis of coal samples

Seam No %C %11 %N % Ash Remarks
VI 77.35 4.95 2.30 3.55 In Whole Sample
VI 78.70 5.30 2.45 2.15
VI 72.75 4.75 2.20 8.95
VI 77.85 5.00 2.45 1.75 Vitrinite Concentration
VI 78.60 5.05 2.50 0.72
VI 78.95 5.10 2.50 1.15
VI 80.20 4.70 2.35 0.08
Geological Survey of Bangladesh 1996

Coal Sale

Up to June 2006, a total of 4, 81,196.53 metric ton of coal has been produced, which includes the production of 3, 03,015.93 metric ton in the fiscal year of 2005-06. The production resulting from the coal produced during roadway development, during the Acceptance Tests of two Long wall and four Road header systems and commercial production from Long wall face. Up to June 2006, 1,89,919.58 metric ton of coal has been sold to the coal-fired industries. This includes the sale of 45,020.44 metric ton of coal during the fiscal year of 2005-06. Total revenue earned from the sale of coal for domestic uses up to June 2006 was Taka 75.85 crore. Up to June 2006, a total of 2, 09,234.57 metric ton of coal has been delivered to Power Development Board at the rate of US Dollar 60.00 Per MT as fixed by the Government.

Applying for purchasing coal

For purchasing coal, an application will have to be made addressed to the Managing Director of Barapukuria Coal Mining Company Limited. Application can be made on a plain paper or on a form available at Markrting Section, Head Office, Barapukuria Coal Mining Company Limited, Chowhati, Parbatipur, Dinajpur. For any assistance regarding this, personnel of the Marketing Section can be contacted.

Payment Method

Payment is accepted in the form of bank draft payable to BARAPUKURIA COAL MINE PROJECT and no cash money is accepted. Bank draft made at Sonali Bank, Barapukuria Coal Mine Project Branch, Parbatipur, Dinajpur or Janata Bank, Phulbari Branch, Dinajpur is preferred to that made at other different banks for quick issuance of delivery order for sale of coal. Delivery order for sale of coal against bank draft made at other than above-mentioned two branches is issued after the confirmation of transfer of money to the the company account, which sometimes may delay up to 48 hours the issuance of delivery order. Payment in the form of bank draft will have to be submitted to the Accounts Section of the Company. For any query regarding this, personnel of the Marketing Section can be contacted.

Measuring Method

At the delivery point, that is, at the mine site, coal is measured by using Computer Controlled and BSTI certified UK made Avery weighing scale.

Coal Loading

Coal can be loaded on the trucks/vehicle by using mechanized pay loading facility provided at the delivery point by Barapukuria Coal Mining Company Limited. Using of the company’s loading facility will cost Taka15.00 (fifteen only) per ton. Coal can also be loaded on the trucks/vehicle by using different facilities provided by other than Barapukuria Coal Mining Company Limited, which may cost approximately Taka 27.00(twenty seven only) per ton.

Transport Facility

For transporting coal, trucks may be available on hire at Phulbari, about 7 km away from the delivery point. Rate of transportation will vary depending up on the destination, route and season of use of coal. As a rough estimate, transportation cost from the delivery point to Dhaka for per tonne of coal may be around Taka500.00.

CONCLUSION

 Power Crisis has been a long clamor in Bangladesh and this seems to persist for the coming decade or so. Beyond optimistic illusions, facts and realities are too fierce to be accepted. Energy infrastructure of Bangladesh is quite small and insufficient but the demand is very high. The per capita energy consumption in Bangladesh is one of the lowest (136 kWH) in the world. Electricity is the major source of power for country’s most of the economic activities. In our country, only 40% of the population has access to electricity because of the shortage of our power generation and this lacking can be filled by using some coal based power plant. From the research we have seen that the environment and transportation system of Bangladesh is positive to establish a coal based power plant. In our country we have few coal pits and the quality of our coal is quite rich and it can be used easily to produce Electricity. In a coal based power plant the Major equipments are 3 units of steam generator, 3 units of steam turbine generator and other associated systems in line with specific tender document taken as reference and as per the scope of work. Besides, fuel details, water arrangements, layout, pollution standards, logistics planning, power evacuation arrangements, water requirements, plant layout, pollution, logistics arrangements and land are required. Now if we focus on our transportation system we will find that most of our transportation route is on plain land. So if any electric power company doesn’t have their own coal manufacture plant then it can easily be transported by road, rail or water transport. Though this transportation costs are a little expensive. Proposals have been made to build a few coal based power plants in our country. Because of some difficulties yet it is not implemented. Growing economies always need a proportional need for power. Considering the recent condition of our country it may be seen that the lack of electricity has been increased day by day. Country like Bangladesh has a required growth in power sector close to 15 %. In order to match the accelerated need of country, there is urgent need to take the challenge to squeeze the time and cost required to complete a coal based power project. It would be a great relief to fund hungry  power projects.

energy

read more
EEE

Supplier Power

Supplier power is a mirror image of the buyer power. As a result, the analysis of supplier power typically focuses first on the relative size and concentration of suppliers relative to industry participants and second on the degree of differentiation in the inputs supplied. The ability to charge customers different prices in line with differences in the value created for each of those buyers usually indicates that the market is characterized by high supplier power and at the same time by low buyer power (Porter, 1998). Bargaining power of suppliers exists in the following situations:

Where the switching costs are high (switching from one Internet provider to another);

High power of brands (McDonalds, British Airways, Tesco);

Possibility of forward integration of suppliers (Brewers buying bars);

Fragmentation of customers (not in clusters) with a limited bargaining power (Gas/Petrol stations in remote places).

The nature of competition in an industry is strongly affected by the suggested five forces. The stronger the power of buyers and suppliers, and the stronger the threats of entry and substitution, the more intense competition is likely to be within the industry. However, these five factors are not the only ones that determine how firms in an industry will compete – the structure of the industry itself may play an important role. Indeed, the whole five-forces framework is based on an economic theory know as the “Structure-Conduct-Performance” (SCP) model: the structure of an industry determines organizations’ competitive behaviour (conduct), which in turn determines their profitability (performance). In concentrated industries, according to this model, organizations would be expected to compete less fiercely, and make higher profits, than in fragmented ones. However, as Haberberg and Rieple (2001) state, the histories and cultures of the firms in the industry also play a very important role in shaping competitive behaviour, and the predictions of the SCP model need to be modified accordingly.

The power of suppliers:

The power of suppliers tends to be a reversal of the power of buyers. Where the switching costs are high e.g. Switching from one software supplier to another.  Power is high where the brand is powerful e.g. Cadillac, Pizza Hut, Microsoft. There is a possibility of the supplier integrating forward e.g. Brewers buying bars.  Customers are fragmented (not in clusters) so that they have little bargaining power e.g. Gas/Petrol stations in remote places.

Huawei began its operations in Bangladesh in 1998. Over the years the company has grown to become one of the leading communication suppliers, providing comprehensive services to all the Bangladeshi telecom operators. the company has become the second biggest supplier to Airtel..

Strategic Partnership with IBM and Ericsson for outsourcing of the Company core IT network activities.

Supplier Power

The supplies in Mobile sectors primarily comprise of Switch Suppliers, Tower Service providers and the Handset providers.

Network Equipments: There are limited Network Equipment providers like ZTE,Nokia Siemens, Ericsson, Huawei. Due to the increase in demand and limited suppliers the power of these suppliers are high and may impact the growth plan of the operators if supplies are not smooth.

Tower Providers: Though the new sharing technology has help in utilizing the Towers but still the coverage remains a problem due to few Tower provider bargaining power of Tower providers if High.

Handset Suppliers: Nokia, Samsung, LG, Sony, iPhone and numerous other players. The bargaining power of Handset Suppliers is less as they are also competing amongst themselves.

Overall we can make out that the key supplies powers are high for Mobile Industry.

Supplier Power

read more
EEEOrganizational Behavior

Drive Test and RF Parameters of GrameenPhone

Abstract

UCE Int. Pvt. Ltd. had been my chosen workplace for Internship Program. I had been working in the organization from 8thOctober to 8th December, 2011. I was assigned as a trainee in the RF Survey to setup the network of GrameenPhone. I was under a Senior RF Engineer and had the full scope and independence to work on the project our project name was “GrameenPhone Drive Test Project”. While working on the project I had the scope to come cross many new thing of the Telecommunication system. This report contains all the information about my work experience with UCE Int. Pvt. Ltd. which starts its operation in Bangladesh from 2006.With in this period UCE work with All Telecom Operators and as also with Vendors. In UCE I have spent a superior time in learning and was content for my efforts, learning and performing. I had the experience of corporate and reporting working environment which affects an employee performance and approach to work, had good time in learning and performing. I had the opportunity to work in practical field. So sometimes I had to deal with harsh situations which RF Engineers experience. For better understanding of the program, we sometimes assigned by my project supervisor to do some study.

Company profile:

UCE was incorporated in 1998 in Malaysia. Today, they have four operational offices in Kuala Lumpur, Hong Kong, Surabaya and Bangalore with headquartered office in Kuala Lumpur to support our on-going projects in different countries. Their core expertise is providing Cellular Network Engineering, Consultancy and Project Management Services for Cellular Network Operators, Equipment Vendors and System Integrators in the wireless telecommunications industry.

As in Bangladesh UCE has started its operation in Bangladesh from 2006.UCE technical team is comprised of fully qualified professionals with extensive knowledge, hands-on experience and expertise in the field of cellular engineering. With the experienced management team and a highly competent technical team, UCE will be able to provide optimum solutions to meet the customer demands in this dynamic industry environment

Our Mission:

UCE offers four main categories of services to wireless telecommunications industry – Network Design & Optimization, Network Deployment, Network Auditing & Consultancy and Network Benchmarking. Our end-to-end services are all supplemented with complete program and project management expertise to ensure every service will result in good quality deliverables. Our expertise covers most Technologies in the world now, ranging from different voice switched networks to packet switched networks, namely GSM, GPRS, EDGE, CDMA and UMTS networks.

Network Design and Optimization

In this service, UCE will provision and allocate engineering resources within your company’s network design and optimization organization. With strong experience in Network Design and Optimization, our expertise will not only help spend up your network deployment but also, will provide on-job training and know-how knowledge transfer to the local engineers.

Network Deployment

This is a turnkey solution. UCE will take full responsibility in network design, optimization, acceptance and project management. With our strong technical expertise and different operation in different countries, we are able to leverage different expertise and ramp up or down project engineering resources easily to meet project requirement. You can be sure to have a good quality network launch

Network Auditing and Consultancy

A mature network with the aggressive growing traffics requires network detailed analysis, good expansion and long term strategy planning. In this service, we provide top consultants with at least 15 year experience in the technologies. Our consultants will audit the network from different aspects from technical to market analysis till long term network expansion strategy.

Network Benchmarking 

Network Benchmarking is an exercise to simulate the mobile users’ perception or to understand the network performance against other networks’ competitors. Different equipment vendors have different statistical formulas and measurement sensitivities. It is no other fair quality indicators except using network benchmark data to compare the network qualities. This exercise will deliver a report to pin-point the network strength, weaknesses and recommend the possible solution to resolve the network quality issues.

Technology:

  • GSM
  • GPRS
  • EDGE
  • TETRA
  • UMTS/WCDMA
  • CDMA

GSM:

Global Standard for Mobile Communication. GSM is a 2G technology after the pure analogue systems. This technology is a TDMA based system with eight time slots per frequency channel. A normal speech call uses one time slot; audio is typically transmitted on one time slot per frame. Each base station provides a base channel with basic information about the network and the base station in the first time slot of a carrier.The original GSM bands are designed at 900 and 1800 MHz but were complemented in the USA by a 1900 MHz band and the 850 MHz that was originally reserved f or analogue AMPS.
Frequency planning on the network side is critical to avoid interference and dropped calls. Interference with neighboring cells can be minimized through GSM features such as power control, DTX and frequency hopping.

GPRS:

General Packet Radio ServiceGPRS was designed to overcome the limitation of GSM technology on data traffic. It supplements today’s Circuit Switched Data and Short Message Service. Theoretically, it can support data speed up to 171.2kpps by combining all eight timeslots at the same time. This is about three times as fast as the data transmission speeds possible over today’s fixed telecommunications networks and ten times as fast as current Circuit Switched Data services on GSM networks. By allowing information to be transmitted more quickly, immediately and efficiently across the mobile network, GPRS may well be a relatively less costly mobile data service compared to SMS and Circuit Switched Data.
The physical layer now consists of four coding schemes (CS), which may be utilized for either the downlink (forward link) or the uplink (reverse link). 

EDGE:

Enhance Data Rates for Global EvolutionEDGE is an expansion of the GSM/GPRS protocol to support higher data rates. This is accomplished by utilizing 8-PSK (8-Phase Shift Keying) modulation technique and modulation coding schemes at the physical layer. This modulation provides an increase from 1 to 3 bits per symbol, thus improving the overall data throughput. The physical layer now consists of nine modulations coding schemes (MCS), which may be utilized for either the downlink (forward link) or the uplink (reverse link).

TETRA:

Terrestrial Trunked RadioTETRA is a TDMA standard, similar to the GSM standard. It uses four timeslots per carrier; the carrier bandwidth is 25 kHz. Similar to GSM, the first timeslot on the first Carrier transmits the BCCH, a logical channel that bears synchronization and control data.TETRA uses π/4 DQPSK (Differential Quaternary Phase Shift Keying). This modulation is highly efficient with spectrum resources, but requires high linearity of all RF components, especially the RF power amplifiers in the radios.The TETRA services are based on three major service classes with different air interfaces, all specified by ETSI:

  • Voice plus Data (V+D), circuit switched speech and data transmission, (ETS 300 392)
  • Packet Data Optimized (PDO), data traffic based on packet switching, (ETS 300 393)
  • Direct Mode (DMO), a simplex voice transmission between two mobiles without using a network. On a physical channel two simultaneous DMO calls can be established. (ETS 300 396)

UMTS/WCDMA:

Universal Mobile Telephone System/Wide Band Code Division Multiple AccessWCDMA is a 3G technology after GSM. This technology is designed based on the CDMA system. CDMA stands for code division multiple access. This means that the available frequency channel is broken down by different code sequences that are multiplied by the user signals of the individual subscribers. All subscribers transmit on the same frequency and at the same time.For WCDMA different base stations are distinguished by a different scrambling code, which makes cell planning a lot easier, since neighboring cells can re-use the same frequency! (However, the occupied “SNR” – or Signal to Noise Ratio is the limiting factor and characteristic for CDMA. 

CDMA:

Code Division Multiple AccessCDMA is a “spread spectrum” technology, allowing many users to occupy the same time and frequency allocations in a given band/space. As its name implies, CDMA assigns unique codes to each communication to differentiate it from others in the same spectrum. In a world of finite spectrum resources, CDMA enables many more people to share the airwaves at the same time than do alternative technologies

Introduction

GSM network consist of different cells and each cell transmit signals to and receive signals from the mobile station, for proper working of base station many parameters are defined before functioning the base station such as the coverage area of a cell depends on different factors including the transmitting power of the base station, obstructing buildings in cells, height of the base station and location of base station etc. The Drive Test (DT) perform in RF optimization GSM network to assure the availability, integrity, & reliability of the network. 

Drive test

Drive-testing plays an important role in creating and maintaining a  strong GSM network.  In mobile communication system drive testing should be used to collect real-time RF information from the field. Generally this is done using a vehicle, but it can also be carried out on foot where circumstances dictate (like inside a building for IBS Testing).In any case, keeping mobile phone network optimized is vital. Changes in the environment continually affect network performance. Operator can’t afford to have unhappy subscribers because there are holes in their coverage or because interference is causing dropped or blocked calls. To migrate to new technologies and applications operators need a drive-test system that will expand with their needs.

The Purpose of Drive Testing

Drive testing is principally applied in both the planning and optimization stage of network development. However, there are other purposes for which drive testing can be used:

  • To provide path loss data for initial site survey work
  • To verify the propagation prediction during the initial planning of the network.
  • To verify the network system parameters.
  • To provide the initial test parameters used in Benchmarking.
  • To verify the performance of the network after changes have been made e.g. when a new TRX   is added; the removal or addition of a new site; any power adjustments or changes  to the antenna; any changes in clutter or traffic habits.
  • To measure any interference problems such as coverage from neighboring countries.
  • To locate any RF issues relating to traffic problems such as dropped or blocked calls.
  • To locate any poor coverage areas.
  • To monitor the network against a slow degradation over time, as well as monitoring the network after sudden environmental conditions, such as windstorm or electrical storms.
  • To monitor the performance of a competitor’s network.

When to Drive Test 

Drive testing can take place during the day or at night and is dependent upon the Operator’s requirements and subscriber habits. Drive testing during the day will imitate the conditions as seen by subscribers, but may clog up the network if call analysis is being performed. Drive testing during the night will allow a greater area to be surveyed due to the reduction in vehicular traffic jam. It will also allow for certain test signals to be transmitted and tested, particularly when setting up a new site, without interrupting normal operation. However, night-time testing does not imitate the conditions experienced by subscribers. For planning purposes, drive testing is typically performed at night and for maintenance purposes, drive testing is performed during the day.

Where to Drive Test 

Some areas of a network will have greater performance problems than others. Drive testing should not be regular throughout the whole network, but should be weighted towards areas where there are significant RF problems. There may be other areas of the network that require temporary coverage during a certain time of the year e.g. an exhibition centre or a sports stadium. These areas should be examined and planned in greater detail. Sometime operators can perform drive test for their customary check for a certain city or some specific clusters of a city.

Types of drive Test 

Drive test can be performed in very many ways. Different types of drive test fulfill different types of requirement from the customer.

  • Single site Drive Test
  • Cluster Drive Test
  • Acceptance Drive Test
  • Site Swapping Drive Test
  • Benchmarking Drive Test
  • Functionality Test
  • Walk Test for IBS

Tools (Drive Test Kit)

Drive testing needs some distinctive type of tools, like some special mobile phones and software. The followings are list of tools generally required for drive test:Hardware:1.  Drive test vehicleFour wheeler vehicles are perfect for drive test to access important but tough access roads or muddy roads.2.  Power InverterThis device inverts DC power to AC power. We can use it to invert vehicle’s DC power to AC power to ensure uninterrupted power supply to the laptop and other electronic devices during DT.3.  Laptop computerDT laptop should be with good condition and configuration, like high speed processor and especially RAM volume should be more for smooth drive testing.4.  Mobile phones and phone chargerSpecial mobile phones designed with field measurement features.  How many mobile phone should we use during DT depends on the types of DT. Some testing requires one phone and some other requires two or more.  Chargers are also compulsory  to keep the phone always charged.5.  Data cablesData cable depends upon the model of the mobile phone. Every mobile phone has its own data cable to transfer measured data to the software installed in the laptop.6.  External antennasEvery mobile phone should be connected with external antenna during DT. Generally when we use mobile phones inside the car during DT, there is an enormous possibility to get poor field data. External antenna can minimize this problem. Usually it is attached on top of the vehicle using a magnetic base.7.  Car GPSGPS generally used for positioning purpose. In DT, positioning is very important both for visualization (current position during DT) and analytical point of view. Car GPS also attached on top of the vehicle like external antenna and connected with laptop through cable.8.  Dongle (Key for DT software)One of the most important hardware for drive test is Dongle. Every drive test software needs this key to run during DT. Except this key all the drive testing features of DT software will be disabled, until the key is not attached with the laptop. Physically it looks very similar as pen drive.9.  USB HubSometime when we need to work with two or more mobile phones then we need more USB ports, but our laptop ports are limited. So we have to use USB hub or PCMC USB card, which will provide us more USB ports to connect more equipment.

DT Route:Data collection Software

This is the software through which field data will be collected. With this software we can analyze the field data also. This software should be licensed from the vendor company for proper authorization. Every software has a key to work properly. The most popular software for data collection is “TEMS Investigation” from ERICSSON.

Digital Map:

During drive test digital map is necessary for finding the way to reach the selected site/cluster and do DT according to some predefined routes. We can load the digital map of the whole region or we can load the map of some specific roads that need drive test. This map comprises all the accessible DT route.

Cellfile:

We must load the cellfile into the data collection software. A cellfile contains all the necessary information related to the site, like ID of that site, assigned frequencies of that site, direction of the antennas of that site etc. Whenever we load the cellfile we can see the position of that site in the digital map. Then we can easily find out our required sites form the map and also the roads to be covered for that site.

TEMS PARAMETERS

On completion of the module one should be clear about the parameters required during drive test what does it mean and how much it is important.Parameters regarding in windows like :a) Current Channelb) Radio parametersc) Serving + Neighbors

Current Channel : 

  • Time: It is system time of computer.
  • Cell name: It displays the name of the sector which is serving according to the cell file that is loaded in TEMS.
  • CGI: It stands for the Cell Global Identity which is unique for every sector of the site. It consists of MCC,MNC,LAC,CI.MCC: Mobile Country Code 0 – 999 (e.g. 404), MNC: Mobile Network Code 0 – 99 (e.g. 98) LAC : Location Area Code 0 -65535 (e.g. 5101) CI: Cell Identity 0 – 65535 (e.g. 11001)
  • Cell GPRS Support:  Tells sector is having GPRS or not. Values are Yes or No.
  • Band: It tells in which Freq. Band mobile is operating e.g. GSM 900/ 1800.
  • BCCH ARFCN: It tells by which BCCH is the mobile station getting served.
  • TCH ARFCN: On which Traffic Freq. call is going on.
  • BSIC (Base Station Identity Code): It is combination of Network Color Code (NCC) (0 – 7) & Base Station Color Code (BCC) (0 – 7). e.g. 62. It is decoded by mobile on every Synchronize Channel Message.
  • Mode: It is shows in which state is mobile operating, Idle, Dedicated & Packet.
  • Time slot: On which time slot of current TCH call is going on. Viz. time slot no. of TRX.
  • Channel Type: Type of channel mobile is getting now.  Like BCCH / SDCCH/8 + SACCH/C8 or CBCH / TCH/F +FACCH/F +SACCH/F.
  • Channel Mode: Shows mode of coding like Speech Full Rate of Half Rate.
  • Speech Codec: It shows FR for Full Rate, HR for Half Rate & EFR for Enhanced Full Rate.
  • Ciphering Algorithm: It shows ciphering algorithm used by the system to protect data for privacy. E.g. Cipher by A5/2.
  • Sub Channel Number: It is displayed at  a time when mobile is on dedicated mode at time of call setup when it is getting SDCCH at that time it shows which SDCCH it is getting out of 8 available. E.g. 2.
  • Hopping Channel:  It shows that current sector is having hopping feature or not. Values are Yes or No.
  • Hopping Frequencies: It displays no. of freq. on which mobile is allowed to hop. viz. MA List for hopping of that sector.
  • Mobile Allocation Index Offset (MAIO): It is the number which tells from which freq. from given MA list for sector hopping has to be started. E.g. 0 means sector will start from first freq. to hop.
  • Hopping Sequence Number (HSN): Indicates sequence in which frequencies are allowed to hop from the MA List. 0- 63. 0 for Cyclic Hopping, 1 – 63 random hopping sequences.

Radio Parameters :

  • RxLev: Receiving level in terms of dBm that mobile is receiving from the site. Range of -30 dBm to -110dBm.
  • RxQual: Quality of voice which is measured on basis of BER. Range of RxQual 0 -7.
  • FER: Frame Erasure Rate it represents the percentage of frames being dropped due to high number of non-corrected bit errors in the frame. It is indication of voice quality in network.
  • BER Actual: Ratio of the number of bit errors to the total number of bits transmitted in a given time interval. BER is a measure for the voice quality in network.. Depending on BER RxQual is measured. E,g, BER 0 to 0.2 %   corresponds to RxQual 0. Max. BER countable and useful is up to 12.8 % which corresponds to RxQual of max. 7.
  • SQI : SQI is a more sophisticated measure which is dedicated to reflecting the quality of the speech (as opposed to radio environment conditions). This means that when optimizing the speech quality in your network, SQI is the best criterion to use. SQI is updated at 0.5 s intervals. It is computed on basis of  BER and FER. For EFR 30, FR – 21 & HR – 17 are respectively ideal values.
  • C/I : The carrier-over-interference ratio is the ratio between the signal strength of the current serving cell and the signal strength of undesired (interfering) signal components. It should be atleast > 9 .
  • MS Power Control Level: Displays range of power control from 0 to 8 depending upon network design. E.g. 0 means no power control and 1 means level that is defined by operator viz. 2 dBm less acc. To airtel.
  • DTX: Discontinuous transmission (DTX) is a mechanism allowing the radio transmitter to be switched off during speech pauses. This feature reduces the power consumption of the transmitter, which is important for MSs, and decreases the overall interference level on the radio channels affecting the capacity of the network.
  • TA: Value that the base station calculates from access bursts and sends to the mobile station (MS) enabling the MS to advance the timing of its transmissions to the BS so as to compensate for propagation delay. Value of 0 means MS in radius of 550mt. From BS.
  • RL Timeout Counter (Cur): This parameter defines the maximum value of the radio link counter expressed in SACCH blocks. Range of 4 – 64 in step size of 4. it shows current value of RLT. Decrease by 1 but increase by 2. When it reaches zero it results in normal DROP Call.
  • RL Timeout Counter (MAX): This parameter defines the maximum value of the radio link counter expressed in SACCH blocks. Range of 4 – 64 in step size of 4. it shows current value of RLT. Normally 16, 20, 24.
  • MS Behavior Modified: This window shows current settings for the mobile station, for instance whether handover is disabled or multiband reporting enabled.

Serving + Neighbor (Figure):

  • Cell Name : Name that describes the neighboring cell as per the cellfile.
  • ARFCN : Channel number mobile receives as neighbor.
  • BSIC : BSIC of the neighboring cell.
  • RxLev : Receiving Level in dBm of neighboring cell.
  • C1 & C2 : These are the cell path loss criterion and cell reselection criteria. Valid during idle mode of mobile station.
  • C31 & C32 : GPRS signal strength threshold criterion C31 and GPRS cell ranking criterion C32. Valid both in packet idle and packet dedicated mode.

GrameenPhone  RF  ParametersCluster test result before and after swap Rx Level Sub dBm before and after SwapRxLev statistic before swap
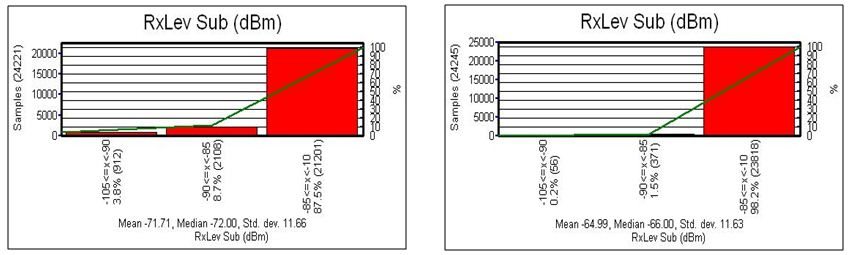
Bar chart 1a: RxLev statistic before swap                                Bar chart 1b: RxLev statistic after swapRxQual Sub before and after swap:bar chart
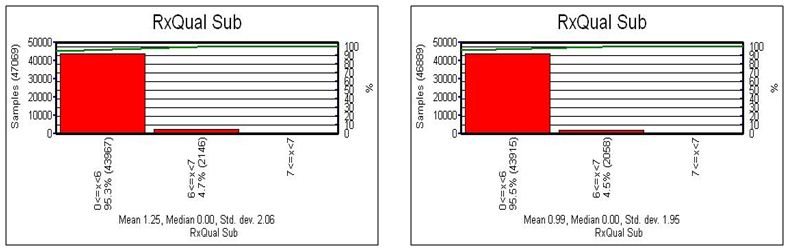
Bar chart 2a: RxQual Sub before swap                        Bar chart 2b: RxQual Sub After swap

Events and statistic before and after Swap:     Preliminary Checklist before Functionality Test

  • Collect Cellfile ; If not available create cell file
  • Collect CDD file or Engineering Information Table
  • Collect Neighbor information table
  • Collect map of the target area with Drive Test route
  • Collect Cluster Boundary Map
  • Collect vector map and street information
  • Contact list with the responsible RF engineers and the OMC/BSS engineers on BSC/NOC
  • Ensure all DT tools and inverters are working properly
  • Ensure there are enough fuels in the car
  • Ensure that there is enough balance in SIM card before leaving
  • Ensure that Car is in good condition
  • Ensure that there are no alarm in the site
  • Calibrate the tools properly & measure if it is same RxLevel for all MS
  • Ensure all the drivers of laptop, mobiles & GPS are installed properly
  • Ensure you have backup software of Win XP, Laptop drivers, GPS drivers, TEMS
  • Ensure  phone battery is fully charged
  • Ensure Laptop is fully charged
  • Ensure you have connected +ve & -ve terminal of the inverter properly with car battery; mark the cables if necessary
  • Fill up the DT daily log sheet
  • Start a test log file to ensure that measurement is working fine
  • Check that you have saved the log files after finishing the measuring tour
  • Keep all the tools & accessories into the tool bag organized. No sharp bandings of cables or cable ties/tapes are not allowed in the bag.
  • Check that you have switched off all the MS at the end of work

Single Site Functionality Test The SSFT is performed with BTSs, Transcoders, BSCs and MSCs installed. The results of each measurement shall be confirmed by pass/fail or registered in the data sheet..The test comprises the following steps in order to perform the SSFT

  •  Execution of Mobile to/from MSC test number on each sector
  •  Execution of Mobile to Mobile calls.
  •  Execution of Originating and terminating SMS from each sector
  •  Verification of correct antenna orientation and correct BCCH on each sector
  •  Verification of BCCH footprints plots with adequate mobile Receive and C/I levels.
  •  Verification of frequency hopping, AMR FR, AMR HR
  •  Verification of Receive and Transmit powers
  •  Verification of Handover and Signal Quality – RxQual (Full & Sub values)
  •  Verification of the Packet data calls (Upload and Download) with GPRS/EDGE if applicable
  •  Verification of working of the inter vendor Handover with the neighboring sites, where ever applicable

Common Problems One of the most common faults with a new site build is swapped feeders. This occurs when the feeder(s) for one sector is connected to a different sector.DT engineer will ensure that there is no problem over the site regarding to sectors swap and bad quality. If DT engineer will find any issues or not sure about that, then he must inform the UCE DT coordinator or BSS engineer of Huawei.Common problems expected are—–1. Swapped feeders.2. Wrong tilts or wrong azimuths.3. Damaged hardware on the sites or other RBSs.4. Parameter errors, sites going down during the drive, or5. Wrong antenna types installed.Feeder Swap /Cross Feeder Test:Procedure 

  • Drive along the main beamwidth of the antenna (around 50 to 250 m)

a)      First preference DT in locked channel per cellb)      Second preference DT in idle mode per cell

  • While driving along sector A, if cell reselected along  B or C or call camped in opposite sector then there is a feeder swap between that two sectors. Similar cases for sector B or C.
  • Also during drive along sector A, if cell A have poor RxLevel (-80 to –95 dBm within 50 m) while other sector (B or C) have good RxLevel (-47 to -60 dBm) then there is a possibility of cross feeder.

Feeder Swap /Cross Feeder Test The first step to identify swapped feeders is to display the strongest BCCH (by signalStrength) along the drive route as shown in figure s.Figure-1 : It is clearly evident that the feeders for Sector1 (BCCH 48) and Sector 3 (BCCH64) are swapped. Alternatively, it could be that the frequency allocations are wrong for those two sectors.Figure-2 : Suppose we run a drive test through the area served by the  cell whose feeders are crossed display the ServBCCH attribute on the Map while the cell sectors are colored by BCCH. This is what we might see:Crossed Feeder Situation
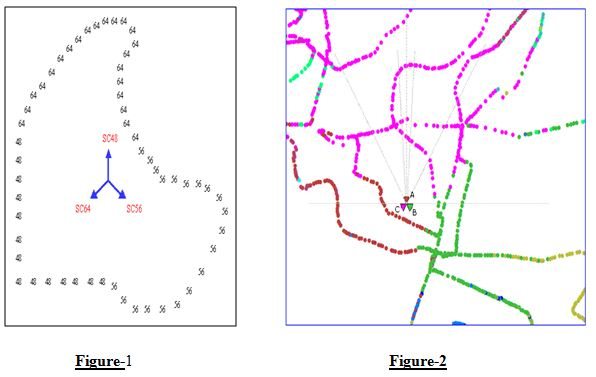
What is Crossed Feeder Issue?

  • There are server types of crossed feeder:
    • Crossed transmit feeders
    • Crossed receive  feeders
    • Crossed transmit and receive feeders

Crossed transmit feeders:Crossed transmit feeders will result in the swap of 2 or more sectors BCCH frequency and TCH’s. As the sectors are pointing in the incorrect direction, performance will suffer as the frequency plan has been changed and a greater degree of interference will be present.In DT, we will find that the handset receives the single which shouldn’t have been received in the current cell.

Crossed receive feeders:It is not easy to detect this fault by DT, because the BCCH frequencies will appear exactly as  they were designed.   However, the statistics for the cell would   help us to detect the fault:

  •    Uplink signal strength would be very poor
  •    Link balance would be larger than expected
  •    Handover success rate would be very low

Crossed transmit and receive feeder:The symptom is similar with the fault “crossed transmit feeder”, and we can detect  the fault      by DT easily .

The problems raised by crossed feeder issue:Crossed feeder will raise many problems, such as:

  •  A greater degree of interference
  •  A poor uplink signal strength
  • A  poor performance of handover

The problems raised by crossed feeder issue:Normal Situation                                     Normal Situation Crossed Feeder Situation                               
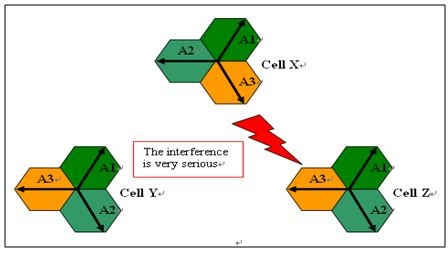
Crossed Feeder Situation.Log Issues

  • Call
  • SMS
  • GPRS
  • Handover
  • Co-channel handover

Call:We take call sample for minimum one minute. it is very important in drive test because through call sample RNO engineer call analyses the present situation of their network quality. By this log the can understand if there is any drop call or silent call and any noise behind the call. They can take necessary steps if the need to improve their service.

SMS:Just we take the record because to see that the sms service is running successfully.

GPRS: Just we take the record because to see that the PDP context activated.

Handover:Handover is an important issue in Drive test or in the swap test. Basically after initialization of the new BTS it is important to observe the proper handover quality in that serving BTS for every cell. There are two types of handover performed during DT of a BTS. These are the Co channel Handover and the Neighbor channel Handover. The purpose of the handover is to see the quality of handover between the co and neighbor channel handover that how frequently the handover is made.Before ho takes place, system needs to decide the best candidate. First it repeats consecutive measurements to rank the cells according to HO algorithm. Please note that HO algorithm in different vendors systems or even in operators using the same equipment could be different. Some systems might rank the cells looking to their signal strength or some can rank them looking to their Path Loss or some can use both.

The purpose of handover analysis in DT is:

  • Understand the wireless handover performance of network.
  • Find out whether the handovers are healthy in this network.
  • What is typical handover failure in this network?
  • Find out whether neighbor audit work is needed in this network.

Co- channel handover:Co-channel handover is the way to handoff the call in other cell of the BTS from the one cell of the same BTS. It is perform to watch the frequent handover capacity of the same BTS.Say this is our BTS and the serving cell is A,B,C. for the co-channel handover we have to hand off the call in an a sequence. Like from A to B then B to C and C to A like the clockwise way. After that we have to maintain the sequence in a alternative way that means the anticlockwise way which means that from A to C, C to B, and then B to A. After this stapes the handover mechanism is performed. During DT in TEMS 8.0.4 we normally perform this operation by targeting the BCCH of the serving cell to handoff the call. Normally co- channel handover perform from the close position of the serving BTS.

Problem in co-channel Handover:

  • If the position of MS is far away from the serving BTS then it is impossible to perform the handover. It is because of the cell direction. Near to the BTS it is quite easy to take handover frequently of the serving BTS.
  • If there is feeder cable swap then it is very difficult to take reading of the co-handover mechanism
  • Some theme the BTS have overlaid and the under laid sub cell. On that case the handover may happen but there is an extra massage “Handover Intracell” which is not good always.

Neighbor handover:Neighbor handover is another basic objective of the DT. It ensures the network quality and the Call drop situation in a network. It also dedicates the coverage gap and the situation of the network coverage.In DT one has to perform the neighbor handover for the every serving cell of the BTS. Normally the handover perform between the neighbor cells of the serving cell which power is greater than any other serving BTS. Normally the handover is performWithout locking the frequency when the MS is in traffic mode and watch out the frequent handover between the neighbor cell. But some time we have to lock the frequency and perform handover by targeting the neighbor frequency.

Problems with the neighbor handover:

  • Handover problem due to vendor separation:  It is some time observes that there is a handover failure because of the vendor mismatch. GrameenPhone just change their BTS from Ericsson to Huawei. As a result it is quite difficult to make handover operation between these two vendors. Because of some parameter related to their technologies. In this situation it is observe that the new BTS keep the call and do not perform the handover operation to any old BTS even when the power level (Rx level) is too poor.
  • Neighbor Cell Missing: Some time it is observed that the handover operation perform  between two neighbor cell which are far away, even there is another cell close to the serving BTS. This situation basically occurs during targeting one frequency from another and the poor signal level due to the building or other things. In this situation during the handover operation suddenly the cell is appear after the handover perform. On that time the “neighbor cell missing “massage just appears.
  • Co- handover Problem: If the whole process start from very close to the BTS then there might be chance of Co handover in the same BTS.
  • Handover Intra cell: The cell from which we handoff the call to the other cell of other BTS, if serve OL and UL sub cell then the handover intra cell situation might come. It also occurs when we go far from the BTS, mostly from the high traffic area to the low traffic area and the TCH conversion from full rate to the half rate traffic.

Conclusion 

In conclusion I have to attest my supervisor Asif Mohammad Badruddoza of UCE Telecom Solution Pvt Ltd. I really appreciate the way I have been guided through this internship program with UCE, beginning from the opportunity to take the time I needed to refresh and expand my knowledge in several issues concerning Drive Test and RF Parameters, over a somehow protected period where I could discover and learn to value my new working environment, and finally earned the confidence to deal with assignments myself. It is through them that I did enjoy my work every day. Having a rare opportunity to use the knowledge and skills that I had acquired, I learned how to handle critical network faults and got the new ideas.Career-wise, the internship program undoubtedly will enrich my curriculum vitae (CV). Also, having gotten a chance to interact with most staff, I have had an insight on how to shape my career towards a humanitarian job in the near future.The internship program gave me a chance not only to work with UCE but also a chance to learn from the good experts. This would reflect much onto my experience. Working with different business organizations was a rare chance for me.

grameenphone

read more