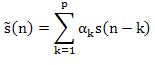
close

EEE

EEE

Design and Implementation of a Frequency

 Introduction:

In a broad sense, the term communications refers to the sending, receiving and processing of information by electronic means. Communication started with wire telegraphy in the eighteen forties, developing with telephony some decades later and radio at the beginning of the century. Radio communication, made possible by the invention of the triode tube, was greatly improved by the work done during world war 2.It subsequently became even more widely used and refined through the invention use of  the transistor, integrated circuits and other semiconductor devices. More recently the, use of satellite and fiber optics has made communications even more widespread, with an increasing emphasis on computer and other data communications.

 A modern communications system is first concerned with the sorting, processing and sometimes storing of information before its transmission. The actuals transmission then follows, with further processing and the filtering of noise. Finally we have reception, which may include processing step such as decoding, storage and interpretation.

 In order to become familiar with these systems, it is necessary first to know about amplifiers and oscillators, the building blocks of all electronics processes and equipment. With these as a background, the everyday communications concepts of noise, modulation and information theory, as well as the various systems themselves, may be approached. Any logical order may be used, but the one adopted here is, basic system, communication processes and circuits, and complex systems, is considered most suitable. It is also important to consider the human factors influencing a particular system, since thy must always affect in design, planning and use.

 The project – “Design and implementation of a Frequency Shift Keying transmitter and receiver” is designed for undergraduate student. In this project student’s will get a solid overview of communication system, types, technique, transmitter, receiver, FSK modulation, demodulation, and modulator and demodulator circuit.

About this Project

In this project transmission of message signal is a simplexformofwireless                                                                                                                                                                                                                      communication. Here a FSK transmitter is interfaced with a microcontroller to generate the message signal. In the receiver section another microcontroller is used to display the message signal.

Objectives

1. To gather theoretical and practical knowledge about communication system and circuit

2. Identify available methods and technique for FSK modulation, demodulation and

   corresponding circuits.

3. Establish a suitable process for implementing this project.

4. Produce a system to occur transmission and reception of digital signal.

5. Use design patterns, standards and best practices where appropriate.

6. And finally test this entire system.    

 Why this Project?       

 Communication engineering means transmission of message signal from one place to another place. As a student of electronics and communication engineering our main goal is to design a system that is very much related to the main theme of the communication engineering.

 This system is a simplex form of communication. It works like one way broadcasting system.so we can called it a one kind of pager. Our country is progressing technologically day by day. Our system can be applied as an alternative of pager into a small building.

 For above reasons we choose this project.

 Literature review

 History of Communication

Early telecommunications

In the middle Ages, chains of beacons were commonly used on hilltops as a means of relaying a signal. Beacon chains suffered the drawback that they could only pass a single bit of information, so the meaning of the message such as “the enemy has been sighted” had to be agreed upon in advance. One notable instance of their use was during the Spanish Armada, when a beacon chain relayed a signal from Plymouth to London signaling the arrival of Spanish ship.

In 1792, Claude Chappe, a French engineer, built the first fixed visual telegraphy system (or semaphore line) between Lille and Paris. However semaphore suffered from the need for skilled operators and expensive towers at intervals of ten to thirty kilometers (six to nineteen miles). As a result of competition from the electrical telegraph, the last commercial line was abandoned in 1880.

 Telegraph and telephone

The first commercial electrical telegraph was constructed by Sir Charles Wheatstone and Sir William Fothergill Cooke and opened on 9 April 1839. Both Wheatstone and Cooke viewed their device as “an improvement to the [existing] electromagnetic telegraph” not as a new device.

Samuel Morse independently developed a version of the electrical telegraph that he unsuccessfully demonstrated on 2 September 1837. His code was an important advance over Wheatstone’s signaling method. The first transatlantic telegraph cable was successfully completed on 27 July 1866, allowing transatlantic telecommunication for the first time.

The conventional telephone was invented independently by Alexander Bell and Elisha Gray in 1876. Antonio Meucci invented the first device that allowed the electrical transmission of voice over a line in 1849. However Meucci’s device was of little practical value because it relied upon the electrophonic effect and thus required users to place the receiver in their mouth to “hear” what was being said. The first commercial telephone services were set up in 1878 and 1879 on both sides of the Atlantic in the cities of New Haven and London.

 Radio and television

In 1832, James Lindsay gave a classroom demonstration of wireless telegraphy to his students. By 1854, he was able to demonstrate a transmission across the Firth of Tay from Dundee, Scotland to Woodhaven, a distance of two miles (3 km), using water as the transmission medium. In December 1901, Guglielmo Marconi established wireless communication between St. John’s, Newfoundland (Canada) and Poldhu, Cornwall (England), earning him the 1909 Nobel Prize in physics (which he shared with Karl Braun).[11] However small-scale radio communication had already been demonstrated in 1893 by Nikola Tesla in a presentation to the National Electric Light Association.

On 25 March 1925, John Logie Baird was able to demonstrate the transmission of moving pictures at the London department store Selfridges.

Baird’s device relied upon the Nipkow diskand thus became known as the mechanical television. It formed the basis of experimental broadcasts done by the British Broadcasting Corporation beginning 30 September 1929. However, for most of the twentieth century televisions depended upon the cathode ray tube invented by Karl Braun. The first version of such a television to show promise was produced by Philo Farnsworth and demonstrated to his family on 7 September 1927.

Computer networks and the Internet

On 11 September 1940, George Stibitz was able to transmit problems using teletype to his Complex Number Calculator in New York and receive the computed results back at Dartmouth College in New Hampshire. This configuration of a centralized computer or mainframe with remote dumb terminals remained popular throughout the 1950s. However, it was not until the 1960s that researchers started to investigate packet switching — a technology that would allow chunks of data to be sent to different computers without first passing through a centralized mainframe. A four-node network emerged on 5 December 1969; this network would become ARPANET, which by 1981 would consist of 213 nodes.

ARPANET’s development centered on the Request for Comment process and on 7 April 1969, RFC 1 was published. This process is important because ARPANET would eventually merge with other networks to form the Internet and many of the protocols the Internet relies upon today were specified through the Request for Comment process. In September 1981, RFC 791 introduced the Internet Protocol v4 (IPv4) and RFC 793 introduced the Transmission Control Protocol (TCP) — thus creating the TCP/IP protocol that much of the Internet relies upon today.

However, not all important developments were made through the Request for Comment process. Two popular link protocols for local area networks (LANs) also appeared in the 1970s. A patent for the token ring protocol was filed by Olof Soderblom on 29 October 1974 and a paper on the Ethernet protocol was published by Robert Metcalfe and David Boggs in the July 1976 issue of Communications of the ACM.

Communication System

In telecommunication, a communications system is a collection of individual communications networks, transmission systems, relay stations, tributary stations, and data terminal equipment (DTE) usually capable of interconnection and interoperation to form an integrated whole. The components of a communications system serve a common purpose, are technically compatible, use common procedures, respond to controls, and operate in unison.

Basic elements

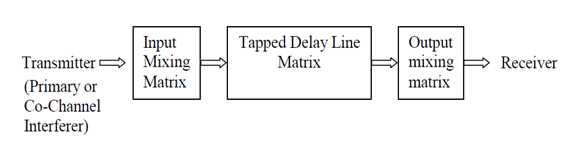
A basic telecommunication system consists of three elements:

  • A transmitter that takes information and converts it to a signal.
  • A transmission medium that carries the signal.
  • A receiver that receives the signal and converts it back into usable information.

For example, in a radio broadcast the broadcast tower is the transmitter, free space is the transmission medium and the radio is the receiver. Often telecommunication systems are two-way with a single device acting as both a transmitter and receiver or transceiver. For example, a mobile phone is a transceiver.

Analogue or digital

Signals can be either analogue or digital. In an analogue signal, the signal is varied continuously with respect to the information. In a digital signal, the information is encoded as a set of discrete values (for example ones and zeros). During transmission the information contained in analogue signals will be degraded by noise. Conversely, unless the noise exceeds a certain threshold, the information contained in digital signals will remain intact. Noise resistance represents a key advantage of digital signals over analogue signals.

 Networks

A network is a collection of transmitters, receivers and transceivers that communicate with each other. Digital networks consist of one or more routers that work together to transmit information to the correct user. An analogue network consists of one or more switches that establish a connection between two or more users. For both types of network, repeaters may be necessary to amplify or recreate the signal when it is being transmitted over long distances. This is to combat attenuation that can render the signal indistinguishable from noise.
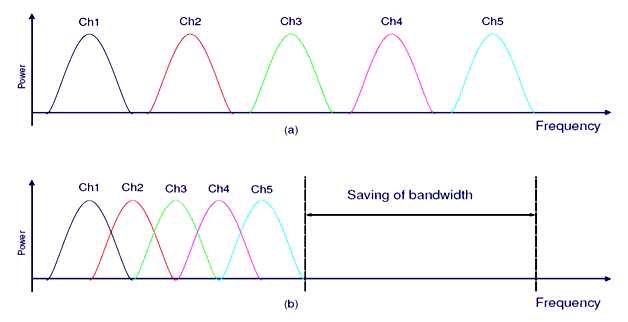
 Channels

A channel is a division in a transmission medium so that it can be used to send multiple streams of information. For example, a radio station may broadcast at 96.1 MHz while another radio station may broadcast at 94.5 MHz. In this case, the medium has been divided by frequency and each channel has received a separate frequency to broadcast on. Alternatively, one could allocate each channel a recurring segment of time over which to broadcast—this is known as time-division multiplexing and is used in optic fiber communication.

Modulation

The shaping of a signal to convey information is known as modulation. Modulation can be used to represent a digital message as an analogue waveform. This is known as keying and several keying techniques exist (these include phase-shift keying, frequency-shift keying and amplitude-shift keying). Bluetooth, for example, uses phase-shift keying to exchange information between devices.

Modulation can also be used to transmit the information of analogue signals at higher frequencies. This is helpful because low-frequency analogue signals cannot be effectively transmitted over free space. Hence the information from a low-frequency analogue signal must be superimposed on a higher-frequency signal (known as the carrier wave) before transmission. There are several different modulation schemes available to achieve this (two of the most basic being amplitude modulation and frequency modulation). An example of this process is a DJ’s voice being superimposed on a 96 MHz carrier wave using frequency modulation (the voice would then be received on a radio as the channel “96 FM”)

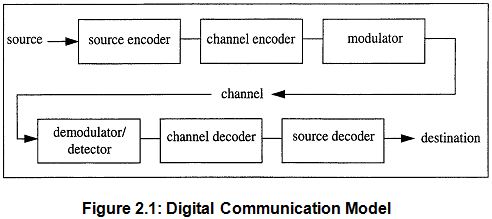
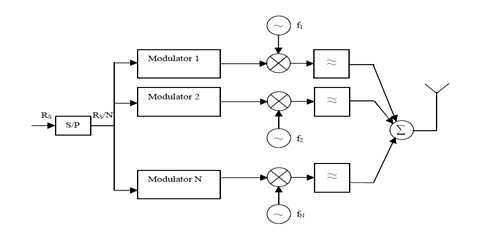
Basic block diagram of a communication system

The System is composed of the following functional Blocks:

The Transmitter

Transmitter includes encoding, compression and error correcting operations, modulation process if some type of carrier to be used.

  The Channel

Where this refers to the available media like transmission lines, fiber cables, the radio frequency spectrum over which the information coming from a transmitter actually propagates or travels to a particular receiver.

The Receiver

Where the receiver performs the processes: decoding, decompressing, comparing error correction codes, demodulating the radio signal to separate it from any carrier that was used.
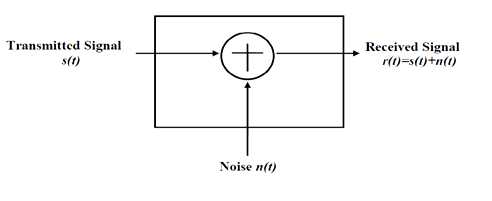
The Noise

The noise is generally normal in communication process. We cannot prevent it but we can minimize it. When you say noise this is unwanted form of a signal that disturbs, interferes and affects the wanted signal in the communication process.

Transmitter

A transmitter is an electronic device which, usually with the aid of an antenna, propagates an electromagnetic signal such as radio, television, or other telecommunications.

Types

Generally in communication and information processing, a transmitter is any object (source) which sends information to an observer (receiver). In radio electronics and broadcasting, a transmitter usually has a power supply, an oscillator, a modulator, and amplifiers for audio frequency (AF) and radio frequency (RF). Sometimes a device (for example, a cell phone) contains both a transmitter and a radio receiver, with the combined unit referred to as a transceiver.

In consumer electronics, a common device is a Personal FM transmitter, a very low power transmitter generally designed to take a simple audio source like an iPod, CD player, etc. and transmit it a few feet to a standard FM radio receiver.

In industrial process control, a “transmitter” is any device which converts measurements from a sensor into a signal, conditions it, to be received, usually sent via wires, by some display or control device located a distance away. Typically in process control applications the “transmitter” will output an analog 4-20 mA current loop or digital protocol to represent a measured variable within a range.

Block diagram of a simple transmitter

                                1 = Audio stage

                                   2= modulator

                                   3= Oscillator

                                   4= RF power amplifier

Description

Item Name Description
1 Audio Stage ·        Amplifies (increases) the weak signal coming from the microphone.
2 Modulator ·        The audio (or data) signal is modulated onto the radio frequency carrier in this modulator stage.

·        Modulation can be by varying the amplitude (or height) of the carrier known as amplitude modulation (am) or by slightly changing its frequency waveform known as Frequency Modulation (FM).

3 Frequency Generator or Oscillator ·        The Frequency generation stages (often known as the oscillator) define the frequency on which the transmitter will operate.

·        Incorrect setting of these stages can easily result in operation outside of the amateur band, and hence interference to other (non-amateur) radio users.

·        The Foundation License only permits the use of commercially available equipment or commercial kits built strictly in accordance with the instructions.

·        The Foundation License does NOT permit you to design and build your own transmitters.

4 RF Power Amplifier ·        The power amplification of the radio signal is carried out in the final stage of the block diagram.  It makes the signal stronger so that it can be transmitted into the aerial.

·        The RF power amplifier output must be connected to a correctly matched antenna (the “Load”) to work properly.  Use of the wrong antenna, or no antenna, can result in damage to the transmitter.

 A practical FM transmitter

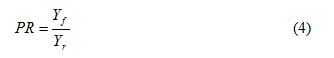
The circuit given below is a two transistor FM transmitter circuit.FM transmitter

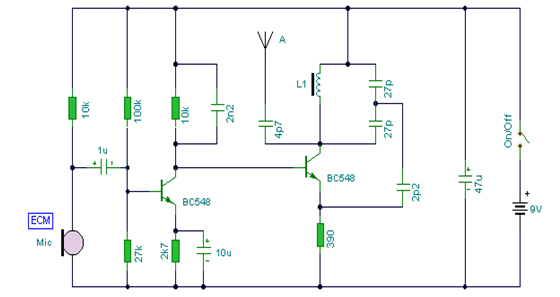
Figure: Two transistor FM transmitter

Receiver

A receiver is an electronic circuit that receives its input from an antenna, uses electronic filters to separate a wanted radio signal from all other signals picked up by this antenna, amplifies it to a level suitable for further processing, and finally converts through demodulation and decoding the signal into a form usable for the consumer, such as sound, pictures, digital data, measurement values, navigational positions, etc.

 Types

Various types of radio receivers may include:

  • Consumer audio and high fidelity audio receivers and AV receivers used by home stereo listeners and audio and home theatre system enthusiasts.
  • Communications receivers, used as a component of a radio communication link, characterized by high stability and reliability of performance.
  • Simple crystal radio receivers (also known as a crystal set) which operate using the power received from radio waves.
  • Satellite television receivers, used to receive television programming from communication satellites in geosynchronous orbit.
  • Specialized-use receivers such as telemetry receivers that allow the remote measurement and reporting of information.
  • Measuring receivers (also: measurement receivers) are calibrated laboratory-grade devices that are used to measure the signal strength of broadcasting stations, the electromagnetic interference radiation emitted by electrical products, as well as to calibrate RF attenuators and signal generators.
  • Scanners are specialized receivers that can automatically scan two or more discrete frequencies, stopping when they find a signal on one of them and then continuing to scan other frequencies when the initial transmission ceases. They are mainly used for monitoring VHF and UHF radio systems.
    Internet radio device

Block diagram of a simple receiver

11                   1=  Tuning and RF amplifier

                       2=  Detection

                       3=  Audio amplifier

                       4=  Loud speaker

Description

Item Name Description
1 Tuning and RF amplifier ·          Tuning selects just the signal we want to hear from all the many different radio signals being transmitted on different radio frequencies.

·          Tuning uses tuned circuits consisting of inductors (coils of wire) and capacitors.

·          The RF amplifier increases the signal received from the air by the antenna.

·          Antenna is connected to receivers by special wires known as feeders.

2 Detection ·          Detection is the process of recovering the original modulating signal.

·          The process is sometimes known as de-modulation (reverse of modulation in the transmitter).

3 Audio Amplifier ·          The audio amplifier increases the detected audio signal to level that can be used with a loudspeaker.
4 Loudspeaker ·          Sometimes headphones are used in place of the loudspeaker.

 A practical FM receiver

TDA7000 FM receiver

Figurefigure:  TDA7000 FM receiver

 Modulation

 The process of superposing low frequency audio signals on waves with high frequency is called modulation. Here, the low frequency signal is called the modulating signal and the high frequency wave, since it carries the information, is called a carrier wave. The resultant wave due to their superposition is called a modulated wave.

 Generally, the carrier wave is a sine wave, which is mathematically represented as:

                                        C (t) = Ac cos(2πfct)

 Where,

Ac= amplitude of the carrier wave

fc = carrier frequency

Necessity of modulation

(1) For effective transmission of high frequency waves, antenna length is small and hence such an antenna can be easily constructed.

 (2) The study of electromagnetic radiation indicates that the transmitted power by an antenna of a given length is inversely proportional to the wavelength X. This point shows that an antenna can transmit short wavelength radiation with more efficiency. Hence for this purpose also, the use of high frequency (short wavelength) waves is inevitable.

 (3) If there is more than one transmitter in a region and if these transmit their respective information simply using frequency of audio signals, then all such signals get mixed. Normally, it is not possible to separate information of one transmitter from the information of other transmitters. Such a situation can be avoided if every transmitter is assigned different high frequencies for information transmission.

 The conclusion of the present discussion is that if the transmission is done using high frequency instead of low frequency, then difficulties do not arise. Hence, the modulation process becomes necessary.

Types of modulation

There are mainly two types modulation.

1.Analoge modulation

2.Digital modulation

Types of analoge modulation

1. Amplitude modulation(AM)

2. Frequency modulation(FM)

3. Phase modulation(PM)

Types of digital modulation

1. Amplitude shift keying(ASK)

2. Frequency shift keying(FSK)

3. Phase shift keying(PSK)

4. Pulse code modulation(PCM)

Amplitude Modulation

In Amplitude Modulation the instantaneous value of the carrier amplitude changes in accordance with the amplitude and frequency variations of the modulating signal.

For example, changes in the signal strength can be used to reflect the sounds to be reproduced by a speaker, or to specify the light intensity of television pixels. It was also the original method used for audio radio transmissions, and remains in use today by many forms of communication—”AM” is often used to refer to the medium wave broadcast band .

         Amplitude Modulation

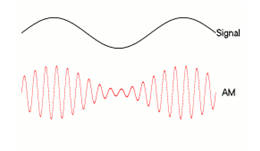
Figure:  Amplitude Modulation

Frequency Modulation

In FM, the carrier amplitude remains constant, while the carrier frequency is changed by the modulated signal. As the amplitude of the information signal varies, the carrier frequency shift in proportion. As the modulating signal amplitude increases, the carrier frequency increases. If the amplitude of the modulating signal decreases the carrier frequency decreases. Frequency Modulation 
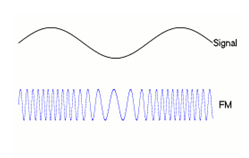
Figure: 2.7 Frequency Modulation

 Amplitude shift keying

Amplitude-shift keying (ASK) is a form of modulation that represents digital data as variations in the amplitude of a carrier wave.

 The amplitude of an analog carrier signal varies in accordance with the bit stream (modulating signal), keeping frequency and phase constant. The level of amplitude can be used to represent binary logic 0s and 1s. We can think of a carrier signal as an ON or OFF switch. In the modulated signal, logic 0 is represented by the absence of a carrier, thus giving OFF/ON keying operation and hence the name given.Amplitude shift keying

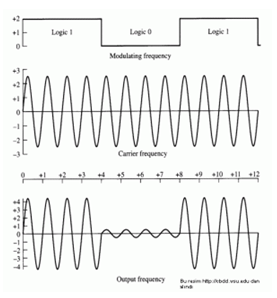
 Figure: Amplitude shift keying

Frequency shift keying

Frequency-shift keying (FSK) is a frequency modulation scheme in which digital information is transmitted through discrete frequency changes of a carrier wave. The simplest FSK is binary FSK (BFSK). BFSK literally implies using a pair of discrete frequencies to transmit binary (0s and 1s) information. With this scheme, the “1” is called the mark frequency and the “0” is called the space frequency. The time domain of an FSK modulated carrier is illustrated in the figures to the right.

Frequency-shift keying  
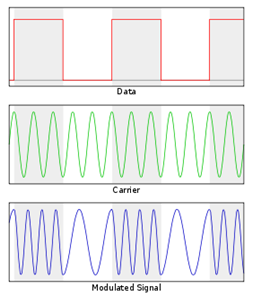
Figure: Frequency-shift keying (FSK)

 PIC16F84A Microcontroller

 Microcontroller Introduction

A microcontroller (sometimes abbreviated µC, uC or MCU) is a small computer on a single integrated circuit containing a processor core, memory, and programmable input/output peripherals. Program memory in the form of NOR flash or OTP ROM is also often included on chip, as well as a typically small amount of RAM. Microcontrollers are designed for embedded applications, in contrast to the microprocessors used in personal computers or other general purpose applications.

Microcontrollers are used in automatically controlled products and devices, such as automobile engine control systems, implantable medical devices, remote controls, office machines, appliances, power tools, and toys. By reducing the size and cost compared to a design that uses a separate microprocessor, memory, and input/output devices, microcontrollers make it economical to digitally control even more devices and processes. Mixed signal microcontrollers are common, integrating analog components needed to control non-digital electronic systems.

A micro-controller is a single integrated circuit, commonly with the following features:

  • central processing unit – ranging from small and simple 4-bit processors to complex 32- or 64-bit processors
  • discrete input and output bits, allowing control or detection of the logic state of an individual package pin
  • serial input/output such as serial ports (UARTs)
  • other serial communications interfaces like I²C, Serial Peripheral Interface and Controller Area Network for system interconnect
  • peripherals such as timers, event counters, PWM generators, and watchdog
  • volatile memory (RAM) for data storage
  • ROM, EPROM, EEPROM or Flash memory for program and operating parameter storage
  • clock generator – often an oscillator for a quartz timing crystal, resonator or RC circuit
  • many include analog-to-digital converters
  • in-circuit programming and debugging support
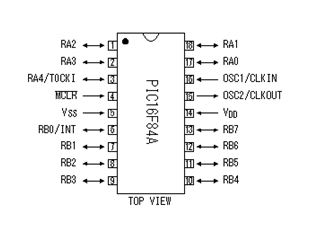
PIC16F84A

This powerful (200 nanosecond instruction execution) yet easy-to-program (only 35 single word instructions) CMOS Flash/EEPROM-based 8-bit microcontroller packs Microchip’s powerful PIC® architecture into an 18-pin package. Easily adapted for automotive, industrial,

appliances low power remote sensors, electronic locks and security applications.


Some features of PIC16f84a are given below.


 Parameter Name  Value


 Program Memory Type  Flash
 Program Memory (KB)  1.75
 CPU Speed (MIPS)  5
 RAM Bytes  68
 Data EEPROM (bytes)  64
 Timers  1 x 8-bit
 Temperature Range (C)  -40 to 85
 Operating Voltage Range (V)  2 to 6
 Pin Count  18

 Pin configuration

pin configaration

Theoretical Representation:

In this project our main objective is to investigate different kind of modulation, demodulation, transmitter and receiver. Here we choose FSK transmitter and receiver, because it can operate with binary bits. FSK is a digital version of Frequency modulation so the basic concepts of FSK remain same as FM.

Frequency Modulation

In telecommunications, frequency modulation (FM) conveys information over a carrier wave by varying its frequency. In analog applications, the difference between the instantaneous and the base frequency of the carrier is directly proportional to the instantaneous value of the input signal.

Suppose the baseband data signal (the message) to be transmitted is

1

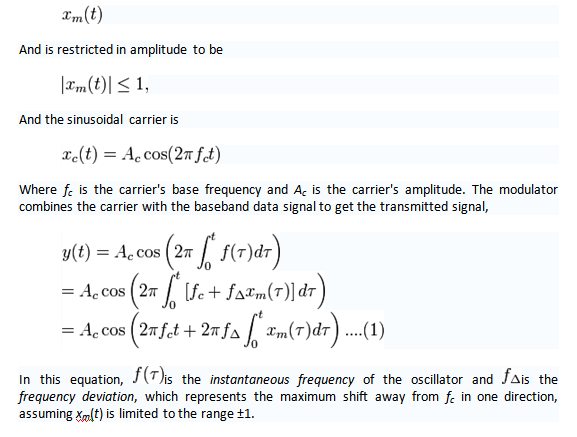
Whilst it is an over-simplification, modulating signals are usually represented as a sinusoidal Continuous Wave signal with a frequency fm. The integral of such a signal is

2

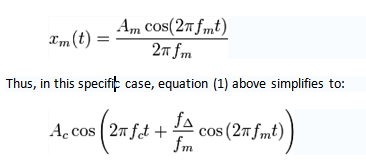
Thus, in this specific case, equation (1) above simplifies to:

Where the amplitude of the modulating sinusoid, is represented by the peak deviation .

The harmonic distribution of a sine wave carrier modulated by such a sinusoidal signal can be represented with Bessel functions – this provides a basis for a mathematical understanding of frequency modulation in the frequency domain.

3 
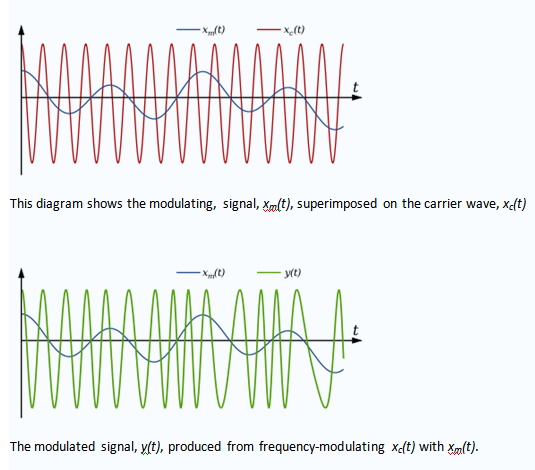
Figure:  Frequency modulation

Modulation index

As with other modulation indices, this quantity indicates by how much the modulated variable varies around its demodulated level. It relates to the variations in the frequency of the carrier signal:

45

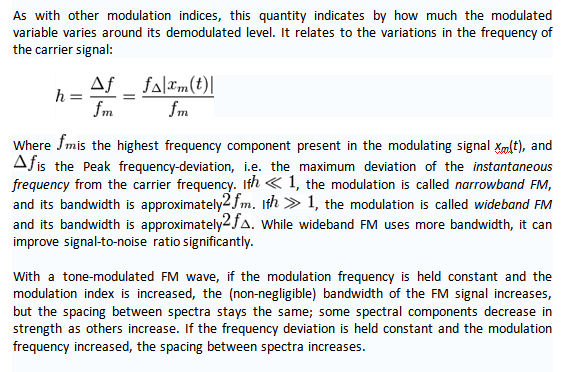
Where is the highest frequency component present in the modulating signal xm(t), and is the Peak frequency-deviation, i.e. the maximum deviation of the instantaneous frequency from the carrier frequency. If, the modulation is called narrowband FM, and its bandwidth is approximately. If, the modulation is called wideband FM and its bandwidth is approximately. While wideband FM uses more bandwidth, it can improve signal-to-noise ratio significantly.

With a tone-modulated FM wave, if the modulation frequency is held constant and the modulation index is increased, the (non-negligible) bandwidth of the FM signal increases, but the spacing between spectra stays the same; some spectral components decrease in strength as others increase. If the frequency deviation is held constant and the modulation frequency increased, the spacing between spectra increases.
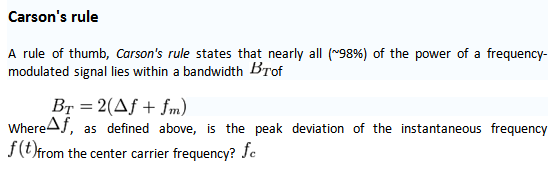
Carson’s rule

A rule of thumb, Carson’s rule states that nearly all (~98%) of the power of a frequency-modulated signal lies within a bandwidth of

 Where, as defined above, is the peak deviation of the instantaneous frequency from the center carrier frequency?

Implementation

FM signals can be generated using either direct or indirect frequency modulation.

  • Direct FM modulation can be achieved by directly feeding the message into the input of a VCO.
  • For indirect FM modulation, the message signal is integrated to generate a phase modulated signal. This is used to modulate a crystal controlled oscillator, and the result is passed through a frequency multiplier to give an FM signal

A common method for recovering the information signal is through a Foster-Seeley discriminator.

Applications

Broadcasting

FM is commonly used at VHF radio frequencies for high-fidelity broadcasts of music and speech (see FM broadcasting). Normal (analog) TV sound is also broadcast using FM. A narrow band form is used for voice communications in commercial and amateur radio settings. The type of FM used in broadcast is generally called wide-FM, or W-FM. In two-way radio, narrowband narrow-fm (N-FM) is used to conserve bandwidth. In addition, it is used to send signals into space.

As the name implies, wideband FM (W-FM) requires a wider signal bandwidth than amplitude modulation by an equivalent modulating signal, but this also makes the signal more robust against noise and interference. Frequency modulation is also more robust against simple signal amplitude fading phenomena. As a result, FM was chosen as the modulation standard for high frequency, high fidelity radio transmission: hence the term “FM radio” (although for many years the BBC called it “VHF radio”, because commercial FM broadcasting uses a well-known part of the VHF band; in certain countries, expressions referencing the more familiar wavelength notion are still used in place of the more abstract modulation technique name).

FM receivers employ a special detector for FM signals and exhibit a phenomenon called capture effect, where the tuner is able to clearly receive the stronger of two stations being broadcast on the same frequency.

A high-efficiency radio-frequency switching amplifier can be used to transmit FM signals (and other constant-amplitude signals). For a given signal strength (measured at the receiver antenna), switching amplifiers use less battery power and typically cost less than a linear amplifier. This gives FM another advantage over other modulation schemes that require linear amplifiers, such as AM and QAM

Frequency shift keying

In digital transmission repeaters can regenerate digital signals and improve the ability against noise interference, and the use of encoding techniques can provide debugging and correction functions. But digital signals often occur distortions due to high frequency components are easily attenuated for a long distance transmission. To improve the disadvantage, a particular processing (modulation) is need for this purpose. Frequency shift keying (FSK) is a type of FM in which the modulating signal shifts the output between two predetermined frequencies – usually termed the mark and space frequencies.

FSK technique is widely used for the transmission of Teletype information. FSK standards have involved for the years. For radio Teletype, the frequency of 2124Hz represents mark or 1, and 2975 Hz represents space or 0.

 For data transmission over telephone and landlines, the commonly used frequencies are:

Space = 1270Hz

Mark = 1070Hz

And

Space = 2225Hz

Mark = 2025Hz

The frequency difference of FSK signals 200Hz.

 Frequency shift keying

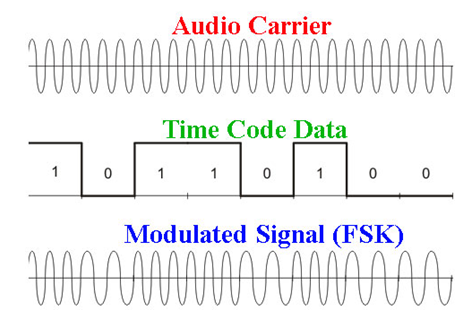
 Figure No:  Frequency shift keying (FSK)

FSK Modulator:

FSK Modulator
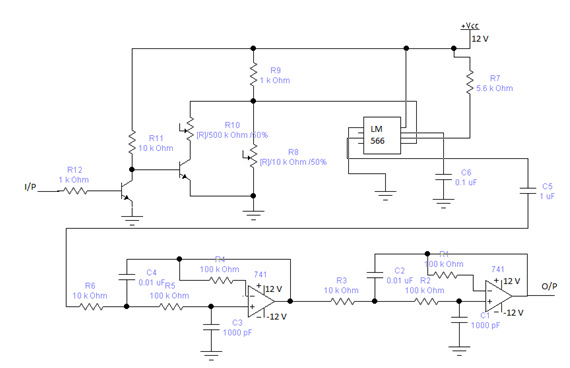
Figure: FSK modulator circuit

The FSK modulator is used to convert the digital signals (square wave) into the analog signal having two different frequencies corresponding to the input levels. In this experiment, we use the frequencies of 1070Hz 1270Hz represent space and, respectively. A voltage controlled oscillator (VCO) can easily generate these two frequencies. A practical FSK modulator using the LM566 VCO is shown in Fig.3.2.In such cases, the oscillating frequency of LM566 can be found by

                                                      fo =2 (Vcc-Vin) / R7 C6 Vcc

Where Vcc is the power voltage applied to LM566 pin 8, and Vin is the VCO control voltage applied to pin 5.

If Vcc is constant, proper value of R7, C6 and Vin are determined to generate the LM566 output frequencies f0 of 1072Hz and 1272Hz. In practice, the limitations of using Lm566 VCO are as follows;

2kΩ≤ R7≤20kΩ

0.75≤Vin ≤Vcc

 f0≤500kHz

10V≤Vcc≤24V

To generate the frequencies of 1070Hz and 1270Hz exactly, the digitals input levels, such as TTL levels 0V and 5V must be converted to proper voltage levels before applying to the input of VCO. The levels shifter (Q1 and Q2) provides this purpose. The Q1 acts as a NOT gate. In other words, when Q1 input is high (5V), then Q1 conducts and the output goes to low (about 0.5V) causing the Q2 to cutoff. If Q1 input is low (0V), the Q1 is off and its output rises to high (5V), and thus the Q2 conducts. When the Q2 is OFF, the input voltage of VCO is given by:

                                            V1 = R8 Vcc / (R8 + R6)

And the output frequency of VCO is f1, when Q2 conducts, the input voltage of VCO is

                                          V2 =  (R10 // R8) Vcc /(R10 // R8) + R9

And the output frequency is f2. Therefore the output frequencies f1 ₌ 1270Hz and f2 =1070Hz can be obtained by carefully adjusting the R10 and R7 values, both U1 and U3 are the second order low pass filters. The four order low pass filter formed by cascading these filter is used to filter the frequency harmonics components on the output of LM566 and therefore the FSK modulated signals obtained.

If the FSK modulated signals mentioned above is desired to transmit by an antenna, a mixer is required to modulate signal to the frequency range in RF band.

FSK Transmitter:FSK Transmitter

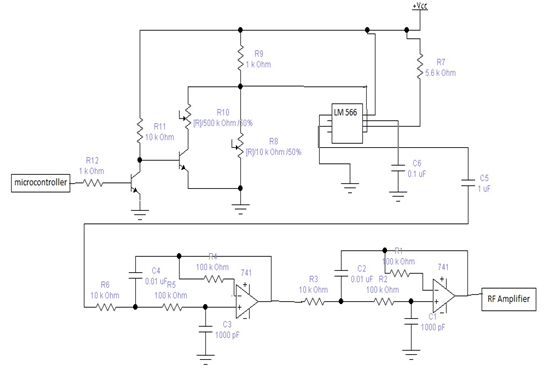
 Figure: 3.4 FSk Transmitter

The above figure shows a Frequency Shift Keying transmitter. Here we use a Microchip manufactured Pic16f84a microcontroller to generate the message signal. Basically we program the microcontroller such a way so that it can generate the ASCCI value of character ‘a’. Then we input this into the modulator.

 After the FSK modulation, the modulated signal is inputted into a RF amplifier module. The RF amplifier module contains a tuning circuit and an antenna.

The output signal of the tuning circuit is in our desired frequency. Then the signal is transmitted through the antenna.

FSK demodulator

 Phase locked loop (PLL)

The digital signal is converted into the FSK signal by the FSK modulator for long distance communications. At receiver section, an FSK modulator is necessary to recover the original digital signal from the received FSK signal. A phase locked loop (PLL) is a good choice for this purpose. In short, the phase locked loop is the control system that tracks the frequency and phase of the input signal. Recently, the PLL is widely used as a demodulator in many types of analog communication systems. Such as the AM demodulator, FM demodulator, frequency selector and Chroma subcarrier acquisition in color TV receiver. Similarly, many digital PLL have been developed to track a carrier or bit synchronizing signal in digital communication systems.

Basically, a PLL includes three major sections:

                     Phase detector (PD)

                     Loop filter (LF)

                     Voltage controlled oscillator (VCO)

Consider the PLL block diagram shown in figure 3.4. If Vin change frequency, an instantaneous change will result in a phase change between A and B and hence a dc level change at the output. This level shift will change the frequency of the VCO to maintain lock. If the PLL is used as an FSK demodulator and the FSK signal is applied to the input the output V1 and V2 will correspond to the input frequencies f1 and f2, respectively. Thus an input frequency change has converted into an output dc level change. When the PLL output is connected to the input of voltage comparator having a reference between V1and V2, the output signal of the comparator is the digital signal, or the FSK demodulated signal.

Block diagram of PLLBlock diagram of PLL 
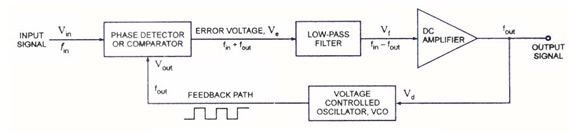
Figure:  Phase lock loop

FSK demodulator circuit

FSK demodulator circuit

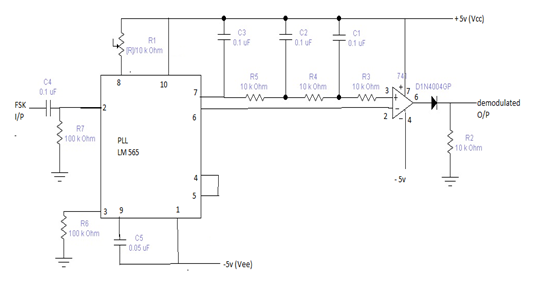
Figure:  FSK demodulator circuit

In the demodulator we use LM565 PLL to perform an FSK demodulator shown in figure 3.5. The LM565 PLL including the phase detector, VCO and amplifier operates below the frequency of 500 kHz. The phase detector operates as a double balanced modulator and the VCO is an integrator-Schmitt circuit. Power supplies +5V and -5V are applied to Vcc (pin 10) and Vee (pin 1), respectively. The FSK signal is applied to the input of the phase detector. Since a frequency multiplier is needless in our project, pin 4 and pin 5 are directly tied together. The reference output (pin6) provides the reference voltage of the comparator U2. The combination of internal resistor Rx and external capacitor C3 operates as the loop filter. The timing components R1 and C5 determine the free running frequency of the VCO. In designing with the LM565, the important parameters of interest are as follows:

Free running frequency

In the absence of the input signal, the output frequency of the VCO is called the free running frequency f0. In the circuit of figure 3.5, the free running frequency of LM565 is determined by the timing components C5 and R1, and can be found by

                                                         f0 ~ 1.2 /4R1 C5

Lock range

Initially the PLL is in already locked state and the VCO is running at some frequency. If the input frequency fi is always from the VCO frequency fo, locking may still occur. When the input frequency reaches a specific frequency where the PLL loses lock, the frequency difference of fi and fo is called the lock range of the loop. The lock range of LM565 can be found by

                                     fL = 8f0 / Vc

Capture range

Initially, the loop is unlocked and the VCO is running at some frequency. If the input frequency fi is close to the VCO frequency fo, unlocking may maintain. When the input frequency reaches a specific frequency where the PLL locks, the frequency difference of fi and fo is called the capture range of the loop. The capture range of LM565 can be found by In the circuit of figure 3.6, components R5, R4, R3, C3, C2 and C1 perform the low pass filter to reduce the output ripple. The digital levels of FSK demodulated signal are compatible TTL levels.

 FSK Receiver

FSK Receiver

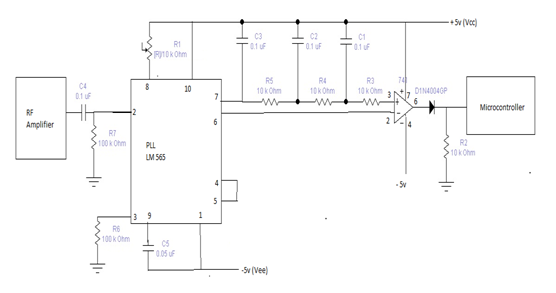
Figure:  FSK Receiver

The above figure shows a Frequency Shift Keying receiver. At first the signal is input into the RF amplifier module. The RF amplifier contains an antenna, a filter and an amplifier.

After filtering and amplification the signal goes to the FSK demodulator. The demodulator recovers the original message signal Then the demodulated signal arrives into the microcontroller. The microcontroller is programmed such a way so that it can read the demodulated signal and convert it into the ASCII value of ‘a’. Then microcontroller will send this value into the output for display.

Design and Implementation

 Tools and components

Modulator

 VCO             IC   LM566

Transistor    C 945

Op amp        IC 741

Microcontroller      PIC 16F84A

Resistors

Capacitors

Breadboard

Oscilloscope

Demodulator

PLL                LM565

Op amp       741

Microcontroller      PIC 16F84A

Resistors

Capacitors

Breadboard

Oscilloscope

Design and Implementation

 Modulator

1 .Arrange all of component needed for the modulated circuit.

2. Connect the circuit properly showed in the figure 3.3.

3. Connect 5V dc to digital signal input using the oscilloscope, observe the LM566 output frequency (pin 3) and adjust R8 variable resistor to obtain the frequency of 1070Hz.

4.  Connect digital signal input to ground (0V) using the oscilloscope, observe VLM566 output frequency (pin 3) and adjust R10 variable resister to obtained the frequency of 1270Hz.

5. Save the output signal generator to TTL level and the frequency of 200Hz and then connect it into the digital signal input.

6. Use the oscilloscope to observe FSK output signal.

Demodulator

1. Arrange all of component needed for the modulated circuit.

2. Connect the circuit properly showed in the figure 3.6

3. Observe the free – running frequency of LM565 and adjust R1 to obtain a frequency of 1170Hz.

4. Connect a 1070Hz, 2VP-P sine wave to the input terminal save oscilloscope vertical input to dc range and observe the output wave form.

5. Change the input frequency to 270Hz and repeat step 4.

6. Apply a 200Hz TTL squire wave to input of FSK modulator.

7. Connect the output of FSK modulator to the input of FSK demodulator.

8. Use the oscilloscope to observe the demodulated output wave form.

After testing the modulator and the demodulator we concentrate at the transmitter and the receiver.

Transmitter

1. Write the program of the microcontroller to generate the serial data correspond to the ASCII value of ‘a’.

2. Then we programmed the microcontroller by the programmer.

3. Connect the microcontroller with the modulator circuit.

4. Design a RF radio frequency amplifier to amply the FSK modulated signal and connect the output of the FSK modulator with the input of RF amplifier.

5. Design a tuning circuit to get our desired frequency and connect its input with the output of the RF amplifier.

6. Connect an antenna with the tuning circuit for the transmission.

7. Finally test the transmission.

Receiver

The FSK modulated signal is received by the receiver antenna.

1. Input the received signal into a RF amplifier.

2. Then connect the RF amplifier output into the FSK demodulator. The demodulator will recover the original message signal.

3. Then write a program for the microcontroller to take input from the demodulator and convert it into the ASCII value.

4. Connect the microcontroller with the demodulator.

5. Finally check the microcontroller output is it the ASCII value of ‘a’.

 Conclusion:

Discussion:

In this project our main goal is to gather knowledge about communication system, different kind of modulation and made a FSK transmitter and receiver. Here we use two microcontrollers with the transmitter and receiver for generate and display the message signal which is the ASCII value of character ‘a’.

The reason of choosing FSK transmitter and receiver is because, its use for long distance digital communication. It is also used in modems. Another application of FSK is at low and very low frequencies (below 300 kilohertz). At these frequencies, keying speeds are limited by the “flywheel” effect of the extremely large capacitance and inductance of the antenna circuits. These circuits tend to oscillate at their resonant frequencies. Frequency-shifting the transmitter and changing the antenna resonance by the same keying impulses will result in much greater keying speeds. As a result, the use of these expensive channels is much more efficient.

 And the main advantage of FSK over CW modulation is it rejects unwanted signal (noise) that are weaker than the desired signal.

 Finally we can say that, we complete this project successfully.

Future Work

Our system is one kind of pager. Our future plan is to interface the transmitter with a PC (personal computer) and make our system possible to transmit, receive and display any kind of short message.

 References:

Books

Communication electronics

       By   Louis E. Frenzel  

Electronics communication systems

      By     George Kennedy

                Bernard Davis

Principles of electronic circuits

      By     Dr. Rezaul Karim Mazumder

Websites:

www.google.com

www.en.wikipedia.org

www.tpub.com

www.microchip.com

www.tutornext.com

www.electronics-diy.com

www.zen.co.ukFrequency

read more
EEE

Nokia Siemens Networks (Part2)

Indirect purchasing:

Indirect purchasing refers to all items that are not sold by Nokia Siemens Networks but are used by Nokia Siemens Networks employees. For example: laptops, phone, office supplies, facility services, software used by employees for daily office work etc.

 Internal purchasing:

Internal purchasing refers to all items that can be sold by Nokia Siemens Networks to its customers but are used inside the company for Research and Development (R&D) material, investment or demo purposes. For example: base stations, cables, OEM items, software used for NSN equipment (eg. labs and testbeds). As opposed to customer orders, internal purchasing do not require a previously defined contract and there is no sales mode specified.

The following types of orders are considered to be internal:

R&D:
Product deliveries for R&D own use, charged to R&D cost center. Experimental (delivery of pre-commercial products, not yet reaching E5 milestone, to customer site in order to test and develop the products with the customer) is one type of R&D delivery.
INVESTMENTS:
Local company investments: internal investments for local company own use (to be remained in local company and used for demonstration, training or testing purposes)
Investment via NSNAM Oy to NSN Oy’s cost center: items purchased if CSM/Split mode project need to order a product for its own use from Hub or NSN factory plant.

DEMO:
Delivery of products to demonstrate pre-commercial and commercial products in exhibitions, fairs, or at the customer premises.
PROTOTYPES:
Products still under development, not available for customer sale yet, used for R&D purposes.

Direct purchasing

Direct purchasing refers to all items that are sold by Nokia Siemens Networks to its customers, covering hardware, services and software.

Strategic procurement activities such as supplier selection, management and development, including contractual arrangements, are done by Global Procurement within Operations.

General Process for indirect purchase:

Indirect Procurement: Indirect Procurement is responsible for selecting, managing and developing the supply base for the indirect goods and services consisting of Travel & Fleet, Manufacturing & Test Equipment, Facility Services, External workforce, and Professional Services (Marketing Services, Corporate Services, Consulting & Training, Auxiliary Supplies).

Indirect purchasing are done in two ways

End to end
Order based purchase

 End to end purchase procedure:

The end to end procurement order process is split in six steps:

Step1: Demand – the requirement coming from the end users

Step2: Approval – for the costs related to the requirement

Step3: Supplier selection and negotiation

Step4: Operational Purchasing – purchase request and order creation

Step5: Goods/Service receiving – related costs booking

Step6: Invoice payment

Demand: The requester is responsible for specifying the demand (need) in a clear and detailed way.

Approval process: The approvers shall follow the Nokia Siemens Networks approval policy. All updated Approval Limits (AL) policies are available in the Global F&C intranet pages Global F&C Approval Limits. In case more stringent unit or country specific rules apply, they ought to be obeyed as well.

Supplier selection and negotiation: Procurement organization is responsible for:

Supplier selection and negotiation

Operative purchasing

Supplier selection is fully described in the SBM process (Supplier Base Management which is almost similar for Indirect and direct procurement and discussed in direct purchase process in details). The negotiation phase is one of the steps of that process.

Only to the purpose of this document, the negotiation step can have different results:

A single purchase order
A frame agreement with or without a price list

The negotiation can be executed in different time frames:

During the standard purchase order cycle, for each purchase request
During the normal sourcing activities, to the scope of signing a frame agreement with a price list included and before issuing any purchase order.

Operational purchasing

The operational purchasing can be classified to 3 main cases:

Order based (also called „standard purchase order‟ process)
Invoice based
Frame agreements with fixed price elements based

Order based process is the preferred one to be used in all cases.

Operational purchasing – Order based process

Order based process is the preferred process and it should be used for the majority of the categories. NSN employees use myOrders as the tool supporting this process. Exceptions are separately defined.
For standardized commodities, this process is also supported by the use of catalogues, which are released by the procurement category area in charge. The usage of these catalogues is mandatory and independent from the order value.

In case of non-catalogue purchase request (the so-called “free text” request), the negotiation is done at a single purchase request level.

This process is applicable to most indirect purchases, such as all software items, laptops, mobile phones, IT equipment, promotional goods, office supplies, (indirect) external temporary labor, etc.

Activities

Responsible person

Create the demand

End users

Approve the costs according to NSN AL (Approval Limits)

All NSN employees according To NSN Limit of Approval policy

Agree on T&C Prices Scope of work Attached relevant documents

GPR INP and GPR IT HW&SW Create the purchase order

Post the GR and enclosed all the relevant documents to

POC

Prove the services/goods are received

End user

Pay the invoice according to the “3 ways match”

SAS

Invoiced based process is used for two main cases, one where Category area has been specified not to benefit from the consolidation of purchases: examples are membership fees, conference fees, IPR (intellectual property rights), etc another is Category area uses frame agreements where consumption is approved per invoice by the internal stakeholder, such as utilities (eg. energy expenses etc.)

The main roles are mentioned below:

Requester – check the content of the invoice using IAT tool, and forward to the cost center approver
Business approver (AP) – approve the invoice according to the NSN Approval Limits (AL) policy using IAT tool and ensure the correct final approver is included in IAT flow. As a principle, no-one can approve own expenses
Invoice posting – SAS posts the invoice in SAP P20 for paying

 Goods/Services receiving

The requester is responsible for timely acknowledge the receiving of goods/services in myOrders tool. In the case of invoice based process, it is responsibility of the business approver to post approval in IAT and, by doing so, release the invoice for payment.

 Invoice payment

Global F&C is responsible for the payment process. For SAP P20 countries (NSN BD), Shared Accounting Services (SAS) is responsible to execute the payment process.

Tools supporting the Indirect Purchasing Process

The relevant tools are:

myOrders for all the requirement/approval/goods receipt process phases
SAP P20 for the PO creation
IAT/P20 for the invoice based process (Invoice Approval Tool)

 General process for Direct Purchasing

Direct Purchasing refers to all items that are sold by Nokia Siemens Networks to its customers, covering hardware, services and software.

The product and service that NSN purchase under direct purchasing are:

Products

Feeder System
R.A Accessories and Y Max Filters
Battery
Core power System
Generators
MDF/ DDF
Outdoor Raw Cable and Accessories
Shelter and containers Air conditioner
Renewable Energy system
Site material – Fixed Networks
Site material – Mobile networks
Standalone Power System
Tower

Services

Civil works
Network Operation and Field maintenance
Outside Plant Material and Services
Project Management services
Site Acquisition
Telecom Equipments

 Resources:

Direct external work force
Temporary Labor

Among these product, service and resource list NSN BD Ltd. do not purchase all of these product service and equipment. Most of them are procured globally. The job of Off shore equipment procurement and purchase the jobs generally done by NSN Finland procurement team y and On shore or local service which mostly includes installation of equipment is done by NSN BD Ltd or via third party (sub Contractors)The Procurement team of NSN BD Ltd generally deals with

MDF/ DDF
Outdoor Raw Cable and Accessories
Shelter and containers Air conditioner
Site material – Mobile networks
Direct external work force
Temporary Labor
Civil works
Network Operation and Field maintenance
Outside Plant Material and Services
Project Management services
Site Acquisition
Telecom Equipments

Strategic procurement activities such as supplier selection, management and development, including contractual arrangements, are done by Global Procurement within Operations. All operational procurement activities for direct materials such as purchase order management and inbound supply daily activities are done by the operational procurement teams in NSN.

The teams those are responsible for the jobs are related with direct purchasing are:

Materials Execution teams within Operations

MEX teams within operation is responsible for securing total cost efficient on-time material availability by operational category management, and inbound logistical model implementation for factory and HUB inbound materials through supplier integration activities. Materials Execution represents the MEX function in category strategy creation and other cross functional teams. Materials Execution contributes to total cost efficient on-time material availability by proactively managing and developing supply networks in order to fulfill customer expectations. This is done by providing global visibility of the whole supply Chain (HUBs, plants, suppliers) and assuring collaboration with suppliers with a solid NSN wide MEX approach.

 Regional Logistics

Regional Logistics is responsible for Order Placement to NSN vendors for Direct Purchasing of Materials and Services needed in Customer Orders related to Local Business. Regional Logistics is responsible for End to End Logistics management, which includes Order Management, Transportation, Inventory management, issuance of purchase orders, handling invoices and delivery from NSN Vendors for Direct Purchasing related Materials and Services for Customer Orders in Local Business. The order placement and delivery has to be in line with the contracts set up by Service Procurement in the region. The delivery can be to the customer warehouse or directly to the site depending on the contractual set up and/or material & service type.

 Purchasing teams within Hardware Services

They are responsible for securing on-time material availability in Hardware Services’ distribution centers. Purchasing contributes to total cost efficient on-time material availability by proactively managing and developing repair and spare supply networks in order to fulfill customer expectations.

Repair Services procurement activities such as supplier selection, management, contracting and development are done by Hardware Services within Services. Spare part procurement tasks are completed according to Hardware Services’ requirements by Global procurement. All procurement activities inside Hardware Services are accomplished according to the guideline of procurement processes defined by Global procurement.

 Supplier Selection

For supplier selection NSN BD Ltd follow the regulations of Supplier Based Management (SBM) process following picture shows the different criteria of supplier selection for different types of product. Three types of SBM is generally used basing on importance of the product. NSN chose which process they will follow to select the supplier from

Full SBM
Medium SBM
Light SBM

At Nokia Siemens Networks (NSN) Global Procurement (GPR) is responsible for the selection of new Suppliers and the management of existing Supplier base for whole NSN. The main input for the SBM process is the relevant Category Strategy which is created in GPR Category team and facilitated by the Supplier Manager for the respective Category.

The Supplier Base Management process covers the following phases:

Supplier Pre-Selection
Supplier Selection
Supplier Management

Supplier Pre-Selection and Supplier Selection describe the onetime activities in order to select the best Supplier in standardized way into NSN Supplier base. Supplier Management describes the cycle based activities to manage and develop NSN Supplier base.

NSN Supplier Base Management process overview, which shows the supplier selection process of NSN.

 Supplier Pre-Selection

The purpose of this phase is to identify new Supplier candidates for NSN. Supplier Pre-Selection consists of the following steps:

Supplier scouting and screening
Early Supplier evaluation
Cost scenario modeling

Supplier scouting and screening

The purpose of Supplier scouting and screening is to gather information on potential sources for technologies, commodities, services and competences needed by NSN in the mid- to long-term. This may include follow- up of standardization initiatives, attending technical and/ or business conferences and exhibitions, performing web searches and visiting Suppliers to get updates on their technology, products, services and roadmaps. Input for Supplier scouting & screening are:

NSN overall strategy and other relevant strategies
Category Strategy
NSN SR
Technology/ service requirements
Technology architecture roadmaps

Early Supplier evaluation

The purpose of the early Supplier evaluation is to prescreen Suppliers based on NSN SR (supplier Requirement). It may cover the following aspects:

Verification of Supplier’s financial status as per NSN Supplier financial and business analysis sub-process
Preliminary validation of technology/ services the Supplier is offering
Validation of key business fundamentals such as logistic services offered, supply capacity
Preliminary validation of Supplier’s ability to meet NSN quality and reliability criteria.

Cost scenario modeling

The purpose of cost scenario modeling is to build up an understanding of the production and business elements that determine the cost of the technology, component, product or service. This provides a basis for cost benchmarking of different technology or service options. If cost scenario modeling is deemed necessary, the respective Supplier Manager is responsible for building the technology/ service cost scenario models in collaboration with Suppliers, cost management and technical experts in NSN. Required input:

Expected annual Spend with this Supplier
Production and business elements
Total cost drivers of that industry
Cost structure of the purchase item

The cost scenario models can help to provide an objective comparison basis for make/ buy decisions.

Minimum criteria for Potential status

After the aforementioned steps of Supplier Pre-Selection have been successfully completed (and minimum criteria have been met) to NSN’s satisfaction, the Supplier may received the status Potential. Minimum criteria for the status Potential:

Non Disclosure Agreement (NDA) signed and available in NSN NOSS
Supplier created in NSN NOSS, basic information about Supplier obtained, evaluated and stored into NSN NOSS
RFI basic information of the supplier received and uploaded into NSN NOSS
Preliminary validation of the Supplier‘s ability to meet NSN SR and technology/ service/ competence checked
Light financial check or public investment grade credit rating stored in NSN NOSS
Supplier Risk Assessment in Light mode stored in NSN NOSS
Business opportunity clearly identified and documented
“No pay” list checked

Supplier Selection

The purpose of this phase is to evaluate, verify and confirm whether Suppliers meet NSN Supplier Requirements. Supplier Selection consists of the following steps

Evaluation
Verification & assessment of the potential Suppliers, resulting in
Contracting for selected Suppliers

Evaluation

The evaluation phase covers an evaluation of potential Supplier candidates. The basic capabilities and compliance to NSN requirements are reviewed and documented in NSN NOSS. If the Supplier has been assessed in the Early Supplier Evaluation phase, only the additional criteria need to be concluded. Evaluation elements can include:

Business opportunity clearly identified and either initial risk & security analysis based on opportunity done or Supplier scanning done
Match with the (Category) strategy and technological requirements
Total cost of ownership (e.g. using material cost breakdown, open book costing)
Supplier Risk Assessment and risk mitigation plan
Dependency (i.e. sole source; difficult technology, IPR)
NSN’s share of the whole business volume
Political & geographical stability in areas where Supplier has operations
R&D support
After sales support
Logistical capability to support NSN globally

Supplier Risk Assessment shall be done for all new Suppliers and additionally in the Supplier Management phase whenever there are significant changes in the business environment (e.g. ownership, financial situation, business volumes, and manufacturing locations).

The relevant Category/ Sub-Category team will review the list of potential Suppliers and nominate the ones that will be taken to the Verification & Assessment phase. Depending on the Supplier financial analysis questionnaire a financial analysis shall be conducted. Required input:

Expected annual Spend with this Supplier
Production and business elements
“No pay” list

The status Potential is not a permission to start delivering products to NSN. As a rule, no business commitments shall be made with a Potential Supplier.

Verification and Assessment

The purpose of the verification and assessment phase is to ensure that the Potential Supplier is capable of performing according to NSN SR with manageable and identified risk.

The NSN Supplier Audit Framework defines guidelines to all Supplier audits, and assessments, applied within all phases of the SBM process.

In the initial Supplier Selection, the assessment is based on the comprehensive NSN SR.

A Lead Auditor is nominated for all assessments and audits. The Lead Auditor is responsible for planning (including resource planning), executing, reporting and following up the assessments/ audits.

Assessment and audit reports are stored in NSN NOSS for shared visibility and traceability.

Any nonconformity identified shall be recorded in the audit report (or Supplier self assessment) and a corrective action plan shall be agreed. The Supplier is solely responsible for the creation of the corrective action plan and its execution.

Contracting

The purpose of contracting is to create a legally binding contract between the parties in order to secure the NSN business interest and to mitigate risks.

The Category Cluster/ Category team will nominate a Head Negotiator who, by default, is the nominated Supplier Manager. The Supplier Manager is responsible for contracting and contract management. The relevant parties as defined in the NSN Supplier Contracting process shall be informed about the contract content.

The Supplier Manager is responsible for Requests for Quotation and budgetary pricing for the respective Supplier.

Findings from Verification and Assessment may influence the contract with the respective Supplier, so the assessment should be conducted before finalizing the contract.

At the end of Contracting the Vendor master data management sub process need to be done in order to manage the outcome of Contracting into the Purchasing system (P20 SAP system).

Minimum criteria for Approved status

When the Supplier Pre-Selection and Supplier Selection have been completed successfully the Supplier may be granted the status Approved, for Full SBM approach.

Minimum criteria for the Supplier status Approved are:

Potential status has been approved
Supplier Manager agreed
Supplier has completed the RFI and this is available in NSN NOSS
Risk assessment done with an appropriate tool, covering level of risk arising from e.g. environmental issues, ethical issues, business dependency, political or geographical risks
Supplier has passed NSN Supplier assessment, level of compliance with NSN SRhas been verified and Audit report is documented in NSN NOSS, if needed corrective action plan is agreed.
Risk mitigation plan done if applicable according to the relevant NSN risk management processes
Verification of Supplier’s financial status done
Supplier checked against “no pay list” and against “Red Flag” Location bank account details
NSN Frame Purchase Agreement or NSN Conditions of Purchase signed acc. Contracting sub process
Optional or specific requirements:
Alignment with the NSN Category Strategy verified for business and technology
Total cost of ownership analyzed
Validation of key business fundamentals such as logistic services offered and supply capacity completed to NSN’s satisfaction
R&D support and/ or After sales support verified

When the Supplier has been granted Approved status, business transactions are allowed to be started.

Supplier Risk Assessment shall be done for all new Suppliers and additionally in the Supplier Management phase whenever there are significant changes in the business environment (e.g. ownership, financial situation, business volumes and manufacturing locations).

Minimum criteria for restricted status

When the relevant process steps for Supplier Selection have been completed successfully the Supplier may be granted the status Restricted, for Medium SBM approach.

Minimum criteria for the Supplier status Restricted are:
Supplier Manager agreed
Supplier created in NSN NOSS, basic information about Supplier obtained, evaluated and stored into NSN NOSS

Supplier has completed the RFI and this is available in NSN NOSS

Risk assessment in Light mode done with an appropriate tool, covering level of risk arising from e.g. environmental issues, ethical issues, business dependency, political or geographical risks
Supplier has stated their compliance or otherwise acceptingly responded to the requested elements of NSN SR in a self assessment response or passed NSN Rapid assessment for SBM Medium approach successfully and potential corrective action areas identified and communicated for Supplier’s corrective actions.

Risk mitigation plan done if applicable according to the relevant NSN risk management processes

Verification of Supplier’s financial status done
Supplier checked against “no pay” list and against “Red Flag” Location bank account details Non Disclosure Agreement (NDA) signed and available in NSN NOSS
Signed conditions of purchase agreement or any other applicable contract type

Optional or specific requirements:

Purchase Agreement signed for direct material Category Clusters
If the Supplier is not originally selected by OPS GPR please attach evidence (as file to respective status template) e.g. the mail from the responsible Business Group Sponsor/ 2nd level GPR Approver

When the Supplier has been granted Restricted status, limited business transactions are allowed to be started.

Supplier Management

The purpose of Supplier Management is to maintain and develop NSN’s approved Supplier base and to further develop some strategic relationships to Preferred status. Supplier Management is done according to implementation matrix to ensure continuous performance improvements of Suppliers in alignment with NSN business requirements.

Supplier Management consists of the following steps:

Relationship Management
Performance Management
Strategic Development
Phase-out

Relationship Management

Good Relationship Management and hence good Supplier relationships are of key importance to NSN. Relationships are the result of all daily transactions with the Supplier by all parties involved. They are based on mutual respect, interests, understanding and prospects. GPR communication should be conducted based on External Communications rules. Both the Supplier and NSN have an equally important role in building up a good relationship – neither party can do it alone.

A good relationship with a good performance and technology/ product/ service match may lead to a strategic alliance or a close and mutually advantageous relationship.

A good relationship requires proactive collaboration from both parties, including regular meetings.

Supplier Manager acts as the escalation point in the relationship with the Supplier.

Key tasks in Relationship Management include such as, but are not limited to:

Communications,
Contract Management together with project contract creation,
To choose from existing Supplier base the best Supplier for certain project,
Supplier Business Plan creation and maintenance,
Status update,
Internal Supplier team

Minimum criteria for preferred status

Status Approved given
Strategic alignment
Good/ outstanding performance
Full SBM process followed/ documentation available in NSN NOSS, Supplier Business Plan maintained in NSN NOSS

Performance Management

Supplier Performance Management is an essential part of monitoring and developing existing Suppliers on continuous basis.

Supplier performance measurements are necessary activities to enable the operational buyers, GPR Category teams and other stakeholders, such as Project Managers, R&D personnel, to assess and develop Supplier performance based on factual data collected and analyzed on an ongoing basis. It also enables Supplier Manager to give absolute and relative feedback to the Supplier, and enabling the Supplier to consider their performance versus other comparable Suppliers used throughout NSN. The output is to be utilized when planning follow up Supplier assessments and specific development projects, creating a Category Strategy and selecting Suppliers for a NSN project.

Strategic Development

The potential of Supplier Base Management lies in the active development of Suppliers. Based on the Category Strategy, Supplier Performance Evaluation results and assessments a Development Plan can be created and development activities can be started. The purpose of these activities is to get the Supplier to meet NSN (short or long term) requirements in the selected area.

Should the Supplier performance and strategic alignment with NSN so justify, a Supplier may be granted the Preferred status.

A Supplier Development Plan can be created to drive Supplier performance improvements in purchasing, quality, delivery performance and technology/ service. The Supplier Manager is responsible for taking the initiative in the creation and implementation of such a plan and he/ she is supported by a cross-functional team.

Phase-out

Some Suppliers may be phased out as a result of the active Supplier Base Management. Phase-out leads to Disqualified status.

There might be several reasons to phase out the Supplier:

Category Strategy
Obsolete or noncompetitive technology
Poor performance (e.g. in delivery, quality or other areas)
Product end of life
Business conflict (IPR conflict, Supplier has become direct competitor, serious or continuing neglect of confidentiality, strategy conflict, ownership risk, etc.)
Brand risk or policy conflict (e.g. ethical or environmental behavior)
Product safety failure, missing capability or serious noncompliance with NSN SR.

 Specific Objective: 03

To analyze the process of ordering product using myOrder tools in indirect procurement process.

 Related hypothesis

Null Hypothesis: 90% employees think that using myOrder tolls is the best way for ordering and purchasing indirect products.

Alternative Hypothesis: less than 90% employees think that using myOrder tolls is the best way for ordering and purchasing indirect products.

Related question

MyOrder tool is the best way for purchasing good for indirect purchase.

 Responses:

(In the range of 1to 5 from strongly agree t strongly disagree here answer below 3 are counted as agree)

At 95% confidence level testing hypothesis

For testing this hypothesis 30 out of 30 agreed and strongly agreed that MyOrder tool is the best way of purchasing goods.

This hypothesis is tested using Z test

 Z Test: The case can be summarized symbolically

pHo =. 963(Hypothesized Mean)

qHo= (1- pHo) = 0.033

n =30 (sample size)

= 90%

σp ={ (pHo*qHo)/ n}^0.5

={( 0.963* .033)/ 30} ^0.5

= .05477

Zobserved = ( – pHo )/ σp

= {(.963-0.9)/ 0.5477}

=1.15

Zcrit =1.64 (at 90% confidence level)

Zobserved < Zcrit so there is no significant evidence to reject the null hypothesis

The figure below shows this hypothesis test graphically.

Acceptance Region

Zcrit= 1.64

Zobs= 1.15

Figure 6: t Test

From the figure above it can be said that the value of Zobs falls within the acceptable range

Findings: from the hypothesis testing it is found that more than 90% employee think that myOrder tool is a good way for purchasing indirect goods.

Requester (RQ): the person who needs the goods, initiator of the purchase request
Business Approver (AP): the person with the correct approval authority and limits, who approves the costs
Category Manager in Global Procurement (SP): the person who negotiates for the best price and/or terms &conditions with the supplier
Purchase Order Center (POC): the team who processes the request and creates the related purchase order into SAP, and handles the operational purchase issues with the supplier, including potential invoice clarifications.

By using this tool the requester can initiate a purchase order specifying the goods and terms of purchasing with the approval of approver (line manager) purchase order is created. Supplier is selected as per NSN’s policy by and category manager in global procurement, which is locally done by indirect procurement team. They place the order to the supplier. The requester receives the goods and then the final process of payment is completed.

By using MyOrder tool requester can directly order his/ her required product and can specify what type of product he/she needs and payment is also done after receiving the goods by requester. So there is very less chance of complain in the case of specification from requester. By this soft ware and via net the total process can be general completed within comparatively lower time period than it was done manually. So the employees of NSN thinks it’s a good way of purchasing product.

Specific Objective: 04

To analyze the Invoice payment system for direct and indirect purchase

 Related hypothesis

Null Hypothesis: 75% employees think that their policy for payment serves the interest of both vendors and organization

Alternative Hypothesis: Less than 75% employees think that their policy for payment serves the interest of both vendors and organization

 Related Question:

These data shows that in most of the cases NSN BD Ltd. takes more than one month to pay the bill. As their invoice payment process is splinted in different countries of the world, In most of the cases it takes 45days. No payment is done in cash. All the payments are done by check. When the check is issued from the concern country’s office for any vendors a mail is sent to the concern vendor also to inform that a check is issued for payment of credit purchase as per contract of payment. This way of processing and informing the vendor reduces the chances of unusual delay of payment to vendors.

The journal entries for invoice payment of direct or indirect purchase in SAP (system) are given below:

GR Creation

Cost of goods sold/ Opex Dr.

Goods received Cr.

IR creation

Goods received Dr.

Vendor Cr.

Payment process

Vendor Dr.

Bank Cr.

By auto reconciliation the cost goes to cost of goods sold is paid by bank

 Findings

By testing this hypothesis and other related information is found that payment policy of NSN BD LTD serves the interest of both parties. As they take more than a month to pay most of the bills they prepare the contract keeping vendors interest in mind

Specific objective: 05

To find out whether NSN deals with its vendor as a strategic partner or not.

Related hypothesis

Null Hypothesis: 70% of employees say that NSN BD deals with its vendor as a strategic partner.

Alternative Hypothesis: Less than 70% of employees say that NSN BD deals with its vendor as a strategic partner

 Related question

Does NSN BD Ltd. deals with its vendor as strategic partner?

Responses

Zobserved< Zcrit so there is no significant evidence to reject the null hypothesis The figure below shows this hypothesis test graphically. Figure: 12: Showing Z test Acceptance Region Zcrit= 1.96 Zobs= 01.95 Figure12: z Test Source: Primary From the figure above it can be said that the value of Zobs falls within the acceptable range. The questionnaire surveys result shows that most of the employees said that that NSN BD LTD deals with its customer as strategic partner. From the survey result of the vendors, it was found that most of the vendors (70% of surveyed) also agree with the statement. 5.5.5 Response for the question from vendors: Does NSN BD deal with its vendors as strategic partners? Table 05: Showing frequency distribution of vendors survey Frequency Percent Valid Percent Cumulative Percent Valid No 3 30.0 30.0 30.0 Yes 7 70.0 70.0 100.0 Total 10 100.0 100.0 Source: primary Figure 13: pie chart showing frequency distribution of vendors survey Source: primary NSN BD LTD deals with a wide range of vendors from large to small in term of business. It’s not possible to deal like a strategic partner with all. The bonding with the vendor generally depend on how long they are dealing with that particular vendor, importance and availability of the product or service provided by the vendors, yearly turn over with that vendor etc. But NSN BD LTD always tries to be in good relation with all of its vendors as they are the most important parties who help NSN BD Ltd to run their business smoothly. 5.6 Specific objective: 06 To find out whether there is any relationship between good vendor management and vendor development 5.6.1 Related hypothesis Null Hypothesis: There is no significant relationship between good vendor management practice and vendor development Alternative Hypothesis: There is significant relationship between good vendor management practice and vendor development 5.6.2 Related questions Does NSN BD Ltd work for vendor management? Current practice of vendor management is the best. 5.6.3 Responses Table 06: Showing the frequency distribution in cross table NSN BD LTD works for vendors development Total Strongly Agree Agree Neutral Disagree Strongly Agree Current practice of vendor management of NSN BD Ltd is best strongly agree Count 6 1 1 0 8 Expected Count 2.9 1.3 3.2 .5 8.0 Agree Count 4 3 7 0 14 Expected Count 5.1 2.3 5.6 .9 14.0 Neutral Count 1 1 3 1 6 Expected Count 2.2 1.0 2.4 .4 6.0 Disagree Count 0 0 1 0 1 Expected Count .4 .2 .4 .1 1.0 strongly disagree Count 0 0 0 1 1 Expected Count .4 .2 .4 .1 1.0 Total Count 11 5 12 2 30 Expected Count 11.0 5.0 12.0 2.0 30.0 Source: primary 5.6.4 Chi-Square Tests Table 07: showing result of Chi square test using SPSS Value df Pearson Chi-Square 24.264(a) 12 N of Valid Cases 30 . 5.6.5 Symmetric Measures Table 08: Showing the result of contingency coefficient Value Approx. Sig. Nominal by Nominal Contingency Coefficient .669 .019 N of Valid Cases 30 Here tabulated value of Chi-Square is at 10% significant level, (df=12) is 18.548, Calculated value of Chi-Square > tabulated value of Chi-Square so null hypothesis is rejected.

Findings

There is significant positive relationship between good vendor management practice and working for vendor development. Contingency coefficient is 0.66 which is near to 1 shows strong relationship between good vendor management practice and vendor development.

NSN’s thoughts towards supplier development:

NSN BD Ltd believes that vendor development is important for good vendor management.

The chief responsibility of Supplier Development is to ensure that suppliers to Global Procurement meet the performance requirements of Nokia Siemens Networks. This is accomplished through continuous development of chosen suppliers within the supplier base of Global Procurement. The aim is to minimize and mitigate risks identified in supplier interface.

To achieve this goal, from Early Supplier Evaluation Phase onwards Supplier Development evaluates suppliers based on clearly defined NSN Supplier Requirements. A foundation for continuous supplier quality assurance, on the other hand, is set by having negotiated Quality Assurance Appendices in place with suppliers. Supplier performance improvement is also based on having well-defined Key Performance Indicators in place based on which Supplier Development can initiate joint improvement actions with chosen suppliers of Global Procurement. Through Supplier Development Programs Supplier Development assumes the leading role in developing the chosen key strategic suppliers as defined by Global Procurement. The projects conducted within the framework of Supplier Development Programs are called Supplier Quality and Supplier Productivity Excellence Projects.

The chief responsibility of Supplier Development is to ensure that approved suppliers to Global Procurement meet the performance requirements of Nokia Siemens Networks. This is accomplished through continuous development of chosen suppliers within the supplier base of Global Procurement.

The operational design of Supplier Development is founded upon effective minimization and mitigation of identified risks in supplier interface, and is driven by the following objectives:

Supplier evaluation and qualification based on clearly defined NSN Supplier Requirements (NSN SR)
Continuous Supplier Quality Assurance based on negotiated Quality Assurance Appendices
Continuous Supplier performance improvement based on defined Key Performance Indicators
Development of chosen key strategic suppliers with an industry-leading approach based on mutual trust, professional support and well defined process and methodologies

Specific objective: 07

To find out whether NSN as a green company, chose suppliers producing environment friendly goods and services or not.

 Related Hypothesis

Null Hypothesis: 70% employees of believe that NSN give importance on Environment friendly goods suppliers

Alternative Hypothesis: Less than 70% employees of believe that NSN give importance on Environment friendly goods suppliers

Related Question

Being a green company does NSN BD Ltd. gives preference to environment friendly goods and services.

 Response

Using 5point likert scale, from1-always to 5never, taking the value below 3 are taken as positive response

This hypothesis is tested using Z test

 Z test: The case can be summarized symbolically

pHo = 0.70 (Hypothesized mean)

qHo= (1- pHo) = 0.30

n=30 (sample size)

= 0.83

σp = { (pHo*qHo)/ n}^0.5

= {( 0.70*0.30)/ 30} ^0.5

= 0.0836

Zobs = ( -pHo)/ σp

= {(0.833 – 0.70)/ 0.0836}

= 1.589

Zcrit =1.64 (at 90% confidence level tabulated value of Zcrit)

Zobs< Zcrit so there is no significant evidence to reject the null hypothesis

The figure below shows this hypothesis test graphically.

Figure 15: Showing z test

Acceptance Region

Zcrit= 1.64

Zobs= 1.589 1.589 1111111111111111111.51479

Figure : z Test

Source: Primary

From the figure above it can be said that the value of Zobs falls within the acceptable range.

Findings

From the hypothesis test it is found that NSN gives preference to those suppliers who supply environment friendly goods.

 NSN as a Green Company

As a green company NSN require suppliers to have a documented environmental management system (EMS), except in categories where impacts are very low such as research and development, software providers and consultancies. In the case of contract manufacturers, other key suppliers and those identified as having higher environmental risks, this EMS must be certified to environmental management standard ISO 14001.

At the end of 2009, we asked our 150 key suppliers (by purchase expenditure) to confirm whether they have an EMS in place at corporate level and at each individual site which supplies Nokia Siemens Networks. Focusing on direct suppliers of materials only, over 400 sites were included in the survey. Based on supplier confirmations and a review of public data sources, 76 percent of these sites meet Nokia Siemens Networks requirements and work continues with those suppliers who did not yet comply.

It typically takes 12 to 18 months to develop an EMS for each site. As new suppliers are continually selected or existing suppliers supply Nokia Siemens Networks from new sites, this means EMS coverage is unlikely to reach 100 percent at any given time. In 2010, NSN also further improve their data collection process in this area. Cutting emissions related to energy use is a key part of NSN’s corporate responsibility strategy. This includes our commitment to improve energy efficiency in the supply chain.

In 2009, we invited 22 key suppliers to participate in a pilot energy efficiency program. Of these, 19 suppliers provided examples of how they are improving energy efficiency, which we shared together with best practices from our own operations. Suggestions ranged from improving the efficiency of buildings and equipment to streamlining specific manufacturing processes and encouraging employees to turn off equipment when not in use. NSN shared these examples of best practice with all participating suppliers.

NSN have asked suppliers to set targets to improve the energy efficiency of their operations and, where applicable, their products, beginning in 2010.

Targets fulfilled in 2010

Invited a further 30 suppliers (based on high energy intensity and business significance) to participate in our energy efficiency program
Drive implementation of good practices through meetings and target-setting on energy efficiency.

From the discussion it is clear that NSN as a green company always conscious about choosing environment friendly goods suppliers. They themselves also avoid unusual use of resources like paper, Energy, printing materials etc.

Specific objective: 08

To find out whether there is any change in cycle time for procurement of a product or not

Related Hypothesis

Null Hypothesis: More than 75% employees think that Cycle time for procurement of product has decreased more than 7 days each

Alternative Hypothesis: Less than 75% employees think that Cycle time for procurement has decreased less than 7 days each year.

 Related Question

Cycle time for procurement of NSN BD Ltd is decreasing by 7days per year

Response

 Z test: The case can be summarized symbolically

pHo = 0.75 (Hypoyhetical mean)

qHo= ( 1- pHo)= 0.25

n=30 (sample size)

= 0.867

σp ={ (pHo*qHo)/ n}^0.5

= {( 0.75*0.25)/ 30} ^0.5

= 0.079

Zobs = ( -pHo)/ σp

= {(0.867-0.75)/ 0.079}

= 1.47

Zcrit =1.64 (at 90% confidence level tabulated value of Zcrit)

Zobs < Zcrit so there is no significant evidence to reject the null hypothesis

The figure below shows this hypothesis test graphically.

Figure 17: Showing Z test

Acceptance Region

Zcrit= 1.64

Zobs= 1.479

Figure : z Test

Source: Primary data

 Secondary data From NSN BD Ltd.

Findings

It shows that in previous years cycle time for purchasing product has decreased by more than 7 days per year.

But from the data we found that the time period for invoice payment has not changed, only the time due in PO creation has changed and came to a minimum range of 2to 7 days by using my order tools. Now in upcoming days it will only be possible to minimize the cycle time by decreasing payment period. It will also help the organization to increase number of potential vendors who are now not interested to do business just because of longer credit period.

It will also increase the bargaining power and save cost.

 Specific Objective: 09

To find out the growth rate of purchase of NSN

 Related Hypothesis

Null Hypothesis: More than 70% employees said that purchase rate of NSN is growing more than 15% per year

Alternative Hypothesis: More than 70% employees said that purchase rate of NSN is not growing more than 15% per year

 Related question

Purchase rate of NSN BD Ltd. (Direct and Indirect) increasing consistently more than 15% per year

Using 5point likert scale, from1-always- 5never, taking the value 3 and below are taken as positive response

This hypothesis is tested by using Z test

5.9.4 Z Test : The case can be summarized symbolically

pHo = 0.70 (hypothesized mean)

qHo= (1- pHo) = 0.30

n=30 (sample size)

= 0.80 (Observed mean )

σp ={ (pHo*qHo)/ n}^0.5

= {( 0.70*0.30)/ 30} ^0.5

= 0.0836

Zobs = ( -pHo)/ σp

= {(0.80-0.70)/ 0.0836}

= 1.19

Zcrit =1.64 (at 90% confidence level tabulated value of Zcrit)

Zobs< Zcrit so there is no significant evidence to reject the null hypothesis

The figure below shows this hypothesis test graphically.

Acceptance Region

Zcrit= 1.64

Zobs= 1.19

Figure : z Test

Source: Primary

Secondary data related to the issue

Specific Objective: 10

To find out the implementation rate of purchasing contract

Related Hypothesis

Null Hypothesis: More than 80% employees believe that all the contracts for procurement of NSN BD LTD. have been successfully implemented.

Alternative Hypothesis: Less than 80% employees believe that all the contracts for procurement of NSN BD Ltd. have been successfully implemented.

Related question

NSN BD Ltd implements 100% of its procurement contract.

 Response

 Z test:

The case can be summarized symbolically

pHo = 0.80 (Hypothetical mean)

qHo= (1- pHo) 0.20

n=30 (sample size)

= 0.933 (Observed mean)

σp ={ (pHo*qHo)/ n}^0.5

= {( 0.8*0.20)/ 30} ^0.5

= 0.073

Zobs = ( -pHo)/ σp

= {(0.933-0.80)/ 0.073}

= 1.82

Zcrit =1.96 (at 95% confidence level tabulated value of Zcrit)

Zobserved < Zcrit so there is no significant reason to reject the Null hypothesis the null hypothesis The figure below shows this hypothesis test graphically. Figure 21: Showing Z test Acceptance Region Zcrit= 1.96 Zobs= 1.84 Figure: Z Test From the figure above it can be said that the value of Zobs falls within the acceptable range Table 16: Showing list of contracts in 2010: Name of the company are in contract with NSN BD LTD. Nature of Business & Contract Implementation Universal Technology and Engineering Ltd. TI Successful Alliance Computers Ltd. TI Successful Eminence Communication TI Successful GTL Int’l Bangladesh Pvt. TI Successful Crystal Engineers & Builders Ltd. TI Successful MAK Consortium TI Successful Fair & Appropriate Technology Ltd. TI Successful Crystal Future Venture Ltd. TI Successful NJ Wade TI Successful DNS Engineering TI Successful Friends Engineering & Construction TI Successful International Office Equipment (IOE) TI Successful Innovis Telecom Services Bangladesh TI Successful The Three Guys Network Bangladesh TI Successful Woojoo Telecom TI Successful Taurus International Ltd. TI Successful Power Trade Engineering Ltd TI Successful Asia Tel TI Successful GPI Asia Tel TI Successful Matrix TI Successful Siam Installation Materials Successful Chowdhury Installation Materials Successful Paradise Cables Successful BRB Cables Successful Emaco Alam System Successful CERES Installation Materials Successful Metrotelworks NPO Successful TechMahindra NPO Successful 3S Netwrok (BD) LTD NOP Successful R K Engineering & Construction MW Installation Successful Chowdhury Agencies Materials Successful M. Brothers & Communication Co. Ltd. OFC Maintenance Successful Unitedtel MW Installation Successful Crystal Engineers & Builders Limited BTS Installation Successful Zoom International BTS Installation Successful Wave Engineering & Technologies MW Installation Successful Radiocell Communication BTS Installation Successful Technology & Services OFC Maintenance Successful ELPIS Corporation BTS Installation Successful SEAM Telecom Materials Successful CERES Materials Successful Fair & Appropriate Technologies Ltd. MW Installation Successful Paradise Cables Cables Successful Singer Cables Cables Successful BRB Cables Cables Successful Techvally Networks Ltd. OEM Successful AAMRA Technologies OEM Successful Paradise Cables Cables Successful Singer Cables Cables Successful Total number of contract = 48 Response Number of contract Percentage Successfully implemented 48 100 Cancelled/ Not implemented 0 00 From the above data base we can say that the entire contracts are made with the vendors of direct procurement are implemented. So there is no specific reason to reject the null hypothesis. In case of execution an of contract 5.11 Specific Objective: 11 To find out vendors perception towards NSN BD Ltd. 5.11.1 Related hypothesis Null Hypothesis: More than 70% vendors think NSN is a good customer for their product (got less than 3 in the scale of 5) Alternative Hypothesis: Less than 70% vendors think NSN is a good customer for their product (got less than 3 in the scale of 5) 5.11.2 Related question NSN BD LTD is a good customer for its vendors 5.11.3 Response Table 17: Showing frequency distribution of related question Frequency Percent Valid Percent Cumulative Percent Valid Strongly agree 3 30.0 30.0 30.0 Agree 5 50.0 50.0 80.0 Neutral 2 20.0 20.0 100.0 Total 10 100.0 100.0 Source: primary Figure 22: Pie chart showing frequency distribution Source: Primary Using 5point likert scale, from1-always- 5never, taking the value below 3 as positive response This hypothesis is tested using Z test 5.11.4 Z test: The case can be summarized symbolically pHo =. 70 (Hypothesized mean) qHo=(1- pHo) = 0.30 n=10 (sample size) x= 0.8 (observed mean) Sx ={ (pHo * qHo)/ n}^0.5 ={( 0.7* .30)/ 10} ^0.5 = 0.145 tobserved = (p- M)/ Sx = {(.8-0.7)/ 0.145} =0.69 tcrit =1.833 (at alpha= 0.1,df=9 tabulated value of tcrit) tcrit > tobs , so there is not significant reason to reject the Null hypothesis.

The figure below shows this hypothesis test graphically.

Acceptance Region

tcrit= 1.833

Zobs= 0.69

Source: Primary

Tobserved < tcrit so there is no significant evidence to reject the null hypothesis

Basing on only a single question test it’s not possible to conclude any strong findings for that reason some more points are required to be shown. From the data base of questionnaire survey of vendors it is found that

Table 18: Co-relation between years of business with NSN BD LTD and being strategic partners.

Does NSN BD deal with its vendors as strategic partners?

How long are you doing business with NSN BD

Does NSN BD deal with its vendors as strategic partners?

Pearson Correlation

Findings:

There is very insignificant but positive relationship between age of business with NSN BD Ltd and the relationship with its vendors. It means the higher the age of business with the vendors the stronger strategic partner relationship. But the value of Pearson correlation is very low. Means the relationship is very low.

Table 19: Co-relation between yearly turnover and being strategic partner

Yearly turnover with NSN BD Ltd.

Does NSN BD Ltd. deal with its vendors as strategic partners?

Yearly turnover with NSN BD Ltd

Pearson Correlation

 Findings

There is very insignificant but positive relationship between yearly turnover of vendors business with NSN BD Ltd and the strategic relationship with its vendors. Means the higher the turnover (yearly) of business with the vendors the stronger strategic partner relationship. The value of Pearson correlation is very low. Means the relationship is strong.

Related Question

In case of failure to delivery product on time, step that NSN BD takes

Does your organization meet the process with in the lead time

In case of failure to delivery product on time, step that NSN BD takes

Does your organization meet the process with in the lead time

Pearson Correlation

Findings:

The correlation between meeting the delivery process with in the lead time shows that the regularly the vendors complete the process with in pre-declared lead time the flexible initiative (penalty) NSN BD LTD. charges.

From the above findings we can say that Vendors have positive perception towards NSN BD LTD. as their customer.

Specific objective: 12

To show the impact of vendor management on its business

In this research impact of vendor management on its business is shown by limiting its scope. There can be several impact of vendor management system on its business like on time support, longer credit period, after sales service, cost saving etc on generating higher revenue and profit by running business smoothly with. In this research the impact of vendor management is measured in terms of cost saving on its profitability. The relationship between cost saving and

Profitability is ascertained by doing regression analysis below.

 Regression Analysis of cost saving and profitability:

From the data collected above the required values for regression analysis are ascertained. Taking the value of independent (cost saving) and dependent variable ( profitability)

Findings and Interpretation of regression analysis of yearly cost saving and profitability:

The calculated F value 1.065 is less than tabulated value 18.5 (at 2 Degree of freedom) which predicts that if sample size large there will be no impact of yearly cost saving on yearly profitability.
The value of B is positive means there is a positive linier relationship between profitability and cost saving, so there will be an upward trend in regression line.
The equation for regression line is Y = 182.194X – 311.26
The predicted residual values the gap between the regression line and the actual value

The figure below shows the regression line of cost saving and profitability

FINDINGS OF THE ANALYSIS, CONCLUSION AND

RECOMMENDATION

Findings:

In recent days vendor management has become an important part of running any type of business. It has reached to the position of managing an important partner of business from a merely a neglected supplier. Now a day there is a separate field of business where only job of vendor management is done. Many large companies are managing their vendors via vendor management firms. There are also some software and web based solution to manage for vendor management like “Talent20”
There are some well practice rules and steps are widely practiced for better vendor management including supplier selection, preparing contract, contract management and renewal and payment procedure
The vendor management system of NSN BD Ltd is regularly upgrading with the change of time and requirement of situation. Policies regarding procurement and payment are global and applied in all the countries.
Of the total procurement indirect procurement have a small proportion but adequate importance are give to that part as those are important for running the business by fulfilling the individual employee’s need promptly
For meeting the requirement of individual employees fast NSN BD LTD started using a software named MyOrder tool which most of the employees think one of the best tool. By using this tool the requester can place his/her demand for the product with the approval of manager(Approval) and purchase order can be placed within two to seven days which previously required almost a month.
The invoice payment system serves the interest of both parties. Though NSN BD LTD takes 45 days for any kind of payments to vendor except Govt. vendors, but they pay the bills on the preset contract date. Some exceptional cases of delay are there, but those have sound reason behind keeping the payments outstanding. Most of those situation occurs due to not getting the required product as per specification on time
In most of the cases NSN BD LTD deals with its vendor as valued partner. NSN takes special care of its vendors and work hard for vendor’s development by providing different training, setting KPI for their services. They believe the more effort is given of vendor development the better it is for vendor management.
NSN BD LTD claims that it is a Green Company, so they always try to avoid using those products which are harmful for the environment. They are also concern for energy saving. They are not only working for being green alone. They also encourage the vendors supplying environment friendly goods. They prefer those suppliers having ISO certification regarding environment friendly goods
The efficiency in vendor management has decreased the cycle time for procurement to payment for purchasing any product. The cycle time decreased in the part of creating purchase order. Previously they did it manually, but now the product is ordered directly by the requestor via MyOrder tools, which require less time.
The spending on purchase of direct and indirect products has an upward trend. But sometime there are fluctuation in the spending due to some specific reasons like change in technology, inflation etc
NSN BD LTD works very efficient and effective in preparing contract for purchasing goods and service. All most all the contract they made are successfully implemented, In case of service procurement they regularly monitor the quality and speed of work and project management team regularly supervise them for getting best output.
Vendor’s perception towards NSN BD LTD as a customer is good. Vendors are highly interested in doing business with them. Even though the payment system of NSN BD LTD require a bit longer than many other local and multinationals, still their numerous vendors are ready to supply product. Vendors are treated as their strategic partner and are provided support for development.
The larger the amount of business with the vendor the stronger the relationship.
The longer the age of business with vendors the stronger the relationship.
Impact of vendor management on its business is prominent. Their good relationship with vendor helps them to run their business smoothly by saving time and cost. This cost saving has a positive relationship with the profitability of NSN BD LTD.

 Conclusion:

In this research paper, an exhaustive effort was made to analyze the vendor management system of Nokia Siemens Networks focusing on Nokia Siemens Network Bangladesh Ltd. for analyzing the vendor management system few important aspects of vendor management like supplier base management, preparing contract, managing contract, payment process is analyzed.

Mission of vendor management is to provide world class product and services for Nokia Siemens Networks in a cost efficient manner. Vendor managers represent Nokia Siemens Networks in contract negotiations with vendors. Different vendor management group works closely with GPR, business unit representatives to achieve the goals. Vendor management’s key responsibility is to make sure NSN’s deals with suppliers are cost efficient and advantageous.

NSN already have a very updated rule, regulations, guide line and policies for efficient and effective vendor management which is used globally. And these rules are revised with the requirement of situation. These regulations are also prepared keeping vendors interest in mind. For this reason vendors are also interested in dealing with NSN as a valued customer. Though there are some points, which some time resist NSN to choose the best option, but the way the deal with their vendors, provide NSN good support in their business as strategic partner.

Recommendation:

For preparing the research paper on critical analysis of Vendor Management System, it was required to go through the policy and process of it. Observing the whole process and questionnaire survey of both employees and vendors, it is found that current vendor management practice is a good one. The concern persons dealing with this process are highly experienced and educated in relevant field. with due respect to them I would like to recommend few points which was found through the observation and suggestions from both employees and vendors of NSN BD LTD may help them to maintain good relationship, cost saving, timely delivery of the product and service.

NSN BD LTD should focus on reducing the payment period which widen the range of potential vendor and increase bargaining power
In case of indirect purchase by ordering via my Order tools, individual purchase as per requirement is done; if it is processed in the way to purchase in bulk it may reduce the cost of purchasing.
Provide short training on purchasing policies and rule of NSN
The impact of cost saving on profitability is positive. It is also very high because the largest portion of its revenue spend on the purchase of direct products, so little percentage change (increase) in cost saving will have multiplier effect on its profitability. So NSN must focus on cost saving on direct procurement.

BIBLIOGRAPHY:

Books:

Cooper. R Donald and Schindler, S Pamela, “Business Research Methods”, 7th Ed.,

Singapore, McGraw‑Hill Irwin, 2001

Lesikar. V. Raymond, Pettit. D. John, Jr. eds., “Lesikar’s Basic Business Communication”, 8th Ed., Singapore, McGraw‑Hill Irwin, 1996.

Levin. 1. Richard and Rubin. S. David, “Statistics for Management”, 7th Ed., New Delhi, Prentice Hall of India, 1999.

Chen and Liu (2004), “Positive brand extension trial and choice of parent brand” Journal of Product and Brand management, Vol. 13, pp.25-36.

Springen, K. and Miller, A. (1990), “Sequels for the shelf”, Newsweek, (July 9, 2008), pp. 3-42.

Company’s Internal Reports and Policies

Annual Report from 2007- 2010

Website:

Company’s internal website:

Nokiasiemense/GPR_in_brief.aspx.htm

Nokiasiemense/mission-and-vision.htm

Nokiasiemense/vendormanagement.aspx.htm

www.nokiasiemensnetworks.com

fixed-mobile-convergence.tmcnet.com

www.answers.com

www.absoluteastronomy.com

en.wikipedia.org/wiki/Vendor_Management_System

www.oakenterprises.com/documents/vms_bestpractices.pdf

www.tempworks.com/vendor-management-software-vms.php

www.utrs.com/utrs/vendor/vendors

vendorsoft.com

jcibmvms.net

en.wikipedia.org/wiki/Vendor_Relationship_Management

Nokia Siemens Networks

Some are parts:

Nokia Siemens Networks (Part 1)

Nokia Siemens Networks (Part 2)

read more
EEE

Nokia Siemens Networks

INTRODUCTION OF THE REPORT

Introduction:

Vendor Management is not just a part of SCM but part of total business process. Vendor management covers the management process of both the vendors of direct and indirect product’s vendor . The vendor should be considered as a part for an organization. Vendors have to be trained and brought to the level at which the organization is working. The vendor must be fully aware of the production process and planning. He/she has to be connected to the full business process.

Vendor management does not mean frequent changing of vendors. Vendors should be fully integrated in to the system of the organization. Once this happens, then the Vendor can start contributing to the chain and the objective of the organization will be achieved.

Modern Vendor management requires looking into Inventory management, purchase process & management, production management and planning, distribution management last is human resource development. It is a comprehensive activity for an organization. Vendor secretion therefore is a very important function of the management.

As a part of the internship program of MBA this internship report on “Critical Analysis of Vendor Management System and its Impact on Business of Nokia Siemens Networks Bangladesh Ltd.” is submitted

Through this report an individual can expect to have a good knowledge of vendor management system of Nokia Siemens Networks Bangladesh Ltd. In last ten weeks of internship program I have tried my level best to know about the total vendor management process of Nokia Siemens Bangladesh Limited .All the secondary data used for the purpose of preparing report is approximate figure, not the accurate one.

 Report preview:

The report is arranged in six parts as under:

Part – I: This is the introductory part that covers the introduction of the report,

Part – II: This is the organizational part, which will give a general overview of Nokia Siemens Networks Bangladesh Ltd. This will also cover the background, history, Mission, vision, customers, product or services provided, corporate social responsibility of the company

Part – III: project part will cover the background of the study, research problem, problem statement, broad and specific objective, research question and hypothesis, limitation, literature review.

Part – IV: Research methodology part will cover methodology of study, source of data collection, sample size determination, statistical tool of data analysis, and measurement of scale

Part – V: Analyzing specific objective and testing hypothesis part will cover statistical analysis and hypothesis testing related with specific objective

Part – VI: This part will cover major findings conclusion and recommendations.

PART- II

COMPANY PROFILE

Nokia Siemens Networks at a Glance:

Every day a quarter of the world’s population connect using Nokia Siemens Networks infrastructure and solutions. This is a significant part of the resource that, by 2015, will connect five billion people and many more devices and applications. As a result, we really understand the challenges facing you today. We know you need something different to put you ahead of the curve – not just more of the same. Our team of more than 60,000 dedicated professionals in more than 150 countries stands ready to help you transform your network, operations and ultimately, your business, to deliver better, more unique experiences for your customers.

We constantly innovate to provide the smartest solutions, and we have the reach and depth to make those solutions a reality. We understand that changes in one place can have unforeseen consequences in another. So we develop solutions that take into account the bigger picture. And we’ve proven ourselves, time and again.

Basic information:

More than 265 managed services contracts with 380 million subscribers Top 3 player in key carrier markets: #2 wireless, #3 wire line, #2 services, NSN have
600+ Communications Service Provider (CSP) customers in 150 countries including 75 of the top 100 CSPs
Number 1 in mobile broadband with more than 170 customers, number 1 in NGN voice solutions and also number 1 in new generation subscriber data management
A leader in services with 28K+ professionals in more than 150 countries worldwide
Undisputed LTE leadership with the most commercial deals
Best smart device support in 3G – up to 50% less signaling traffic and 80%

 History of Nokia Siemens Networks:

Nokia Siemens Networks (NSN) is one of the largest telecommunicate ions equipment suppliers in the world. NSN was created as a result of joint venture between Siemens AG’s COM division (minus its enterprise business unit) and Nokia’s network business Group.

On June 19, 2006 Nokia and Siemens AG announced the companies would merge their mobile and fixed line phone network equipment businesses to create one of the worlds’ largest network firms, Nokia Siemens Networks. Each company has a 50% stake in the infrastructure company. Nokia Siemens Networks was officially launched at 3GSM World Congress in Barcelona in February 2007. Nokia Siemens Networks then began full operations on April1, 2007 and has its head quarters in Espoo, Greater Helsinki, Finland, while the west-south Europe head quarters and three of its five divisions are based in Munich, Germany. The service division is based in India.

Nokia Siemens Networks operates in approximately 200 countries worldwide and has about 60,000 employees. About 20,000 Nokia employees were transferred to this new company. Its major manufacturing sites are in China, Finland, Germany, Poland and India. About 1 billion people are connected through its networks. The customer base of Nokia Siemens Networks includes 1,400 customers in 150 countries (including more than 600 operator customers). It is foreseen that, at combined 2005 revenue of more than 1.5 billion Euro a year by 2010.

NSN customers required end to end solutions and the pace of their requirements will accelerate in future. NSN can help change the way they do business and capture value. The company believes to listen to the customers, innovate together and solve customers’ most pressing business challenges.

NSN bring the benefits of scale and global reach plus a deep understanding of operator business and industry-leading research and development organization, and wide range of services, products and situations to our customers. But, to success in rapidly evolving communications industry, scale is not enough. Therefore NSN are building an organization and culture that constantly evolves to address our customers’ key challenges and lead industry change.

The explosive growth of network and internet traffic, both in terms of bandwidth and subscribers, represents a great opportunity for operators and equipment providers. However the legacy o enabled through innovative, that the traditional telecoms business has resulted in complex and partly overlapping network layering and architecture. The complexity of network architecture enabled through innovative environmentally sustainable situations that enable rapid growth.

Nokia Siemens Networks start as an undisputed industry leader with the scale and ambition to become the number one enabler of communication services. Already holding a top three position in the telecommunications infrastructure industry, NSN are ideally positioned t utilize our strong end to end convergence capabilities for future growth.

Where from Nokia Siemens Networks Come from:

Nokia Siemens Networks are continuing the legacy of two companies that shaped the communications industry. Siemens has been a pioneer in the communications industry since in the mid 19th century while Nokia pioneered the development of mobile communications and become the world leader in this field.

NOKIA

SIEMENSE

Opportunity through deep consumer understanding
End to end development of communications solutions
Common go-to-go market and customer collaboration
Insights and learning’s of opportunities in different industries.
Strong global presence
Connection to general infrastructure projects

Combining the strength of Nokia and Siemens:

Siemens since 1847

Nokia Since 1865

1855- Russian long distance telephone network

1905- First automatic Telephone exchange

1921- completion of the Rhineland telephone cable

1935- Construction of Telefunken television set

1957- The beginning of data processing

1967- Nokia’s first generation of manual radio telephone systems. (Roots in paper, rubber and cables in just over 100 years Nokia became a powerful industrial conglomerate)

1980- The first telephone exchange using the digital electronic switching system EWSD goes into operation

1982- Europe’s first digital exchange the DX 200

1991- Worlds first GSM call made in Radiolinja’s network, supplied by Nokia

1999- Worlds first triple mode (GSM,EDGE, WCDMA) base station

2001- Build first UMTS network in Europe

2001- Worlds first Multimedia Messaging Service Centre

2004- Industry first commercial end to end 3GPP IP Multimedia Subsystem

2006- Industry first live demonstration of long term evaluation

2007-Pioneering innovators join forces(NSN)

Nokia Siemens Networks Bangladesh Ltd.

Nokia Siemens Networks is one of the largest telecommunications hardware, software and professional services companies in the world. It began operations in Bangladesh on May1, 2007.

The company’s workforce in t he country totals 131 people who are located in Dhaka, and are involved in operations, marketing, services and support.

Nokia Siemense networks is one of the top three network suppliers in Bangladesh and a vendor of choice for all major fixed and mobile Communication Service Providers. Its customers in the country include Banglalink ( Orascom Telecom Bangladesh Ltd ), Teletalk Bangladesh Ltd, Grameenphone Ltd (joint venture between Telenor and Grameen Telecom Corporation), Citycell (Pacific Bangladesh Telecom Ltd.) and Axiata Bangladesh Limited. It also caters nontraditional players such as the Directorate General of Defense Purchase (DGDP).

The company offers a wide range of its products and solutions for radio access, transmission (microwave and optical backbone), switching, Home Location Register (HLR) and Intelligent Network (IN) technology in Bangladesh. With more than 3,000 base station sites supplied, installed and commissioned; 1,100 PDH and SDH links deployed; and over 1,500 km of optical fiber backbone installed in the past three years, Nokia Siemens Networks Bangladesh enjoys a remarkable track record in providing a gamut of services, including implementation and support, to its customers.

As responsible corporate citizen Nokia Siemens Networks Bangladesh is focused on deriving improvements in various areas. It is involved in disaster relief, social welfare and environmental protection amongst other initiatives. For example, it organized help and donation drive for victims of cyclone Sidr.

 NSN’s Vision and Mission:

The road ahead

Until now, development in our industry has mainly been a matter of delivering connections – more, faster, cheaper, and more efficient. This is still important. The connectivity explosion continues, and by 2015 we know that 5 billion people and further billions of devices will be connected. So, we must continue applying our expertise in order to deliver on the reality of hundred-fold increases in traffic. The future of service is largely network-based. Internet applications hosted in the ‘cloud’ (email, social networking sites, corporate service and communication tools, etc.), already account for a large proportion of the services people access every day. Every day, therefore, quality of network experience has more and more to do with quality of life.

Towards an ecosystem of partners

Today, however, we are also focusing like never before on delivering quality – quality experience. We can see that a more open, collaborative and customer-centric way of working could bring so much more value to billions of individuals, and to millions of businesses. We at Nokia Siemens Networks must drive that change by leaving the closed and proprietary mindset behind, and leading the way in a new spirit of openness and collaboration.

 NSN’s customers’ challenges

Our customers, Communications Service Providers (CSPs), face challenges on all fronts: the need to increase efficiency keeps pressure on capital and operational costs; the dramatic rise in traffic due to the proliferation of internet applications demands new business models for monetization; and an ever fiercer competitive climate is challenging CSPs to prove they can retain the customers they have and win back any they might have lost. Nokia Siemens Networks will play a vital role in helping CSPs meet these challenges. This role is our mission – it’s about building value.

Mission

We help communications service Providers build more valuable customer relationships by improving efficiency and experience

We have built value by addressing efficiency, and we continue to do that. But we also need to address the customer’s need for a better experience, because it’s experience that builds relationships, and relationships that build value.

Vision

The individual communication experience

We believe that CSPs can ultimately enable and deliver a “segment of one” – where they can define and enhance the service experience for each and every individual. A customer whose communications experience fits and works for them don’t change operators. And operators who can devote themselves to enriching the customer’s experience build stronger, more lasting and profitable customer relationships.

The individual communications experience is the greatest value a communications service provider can deliver to their customer, and so it’s the greatest value we can support communications service providers in delivering.

The road ahead

Ultimately every service is delivered to an individual. And those individuals will benefit from the services being delivered in a way that fits their personal needs and desires. This experience cannot be the privilege of the few. It must be as true for customers in emerging countries with just a dollar to spend, as for businesses in developed countries with greater resources, and for the trillions of devices that make up the Internet of Things.

Our vision acknowledges that communications service providers need to manage this complexity wisely, ensuring the necessary security and authentication for users, while having the ability to profitably deliver a customized experience, based on a person’s locations, context, device, usage patterns and preferences.

Our vision guides our mission, and our mission is to build more valuable customer relationships. The individual communications experience builds more valuable customer relationships.

Values:

“Regardless of who we are we all shape our culture in our daily interactions. To enrich our NSN culture, we have agreed five values for NSN. We all are responsible to embed these principles to guide our actions and serve as our cultural cornerstones. Working groups across NSN have documented behaviors that link our values to our daily business. The value innovate is recently highlighted in many occasions. It is imperative to strengthen our competitiveness. You can find more about innovation on strategy and business development’s pages”

Business Units of NSN:

Starting January 1, 2010, Nokia Siemens Networks realigned its Business Units around the three key areas

Business Solutions (BSO)
Network Systems (NWS)
Global Services (GS)

With three dedicated sales units covering these areas.

Board of directors:

Chairman: Olli Pekka Kallasvuo
Vice Chairman: Rudi Lamprecht
Juha Äkräs
Joe Kaeser
Siegfried Russwurm
Niklas Savander
Rick Simonson

Executive Board

Chief Executive Officer: Rajeev Suri
Customer Operations(CO): Bosco Novák
Chief Financial Officer (CFO): Luca Maestri – Resign with immediate effect with no successor
Chief Technology Officer (CTO): Hossein Moiin
Head of Network Systems: Marc Rouanne
Head of Business Solutions: Jürgen Walter – Resign with immediate effect with no successor
Head of Marketing and Corporate Affairs: Barry French
General Counsel: Joyce Norcini
Head of Strategy and Business Development: Michael Matthews
Head of Operations: Herbert Merz
Head of Human Resources: Hans-Jürgen Bill
Head of Corporate Development Office: Pekka Soini
Head of Services: Armando Almeida
Head of North America Region: Susan Spradley

 Products

 Broadband Connectivity

Nokia Siemens Networks provides solutions for the following challenges under the name of “Broadband Connectivity”

The quad play of high-speed Internet, voice (VoIP), and video services (DVB/IPTV) in fixed networks, together with mobile connectivity – plus the steadily increasing demand for bandwidth that goes with it – are today’s challenges for fixed and mobile operators and ISPs, both on the access and the transport side.
Access switches

These switches fit well into a variety of deployment scenarios for city networks or Enterprise connectivity solutions.
Carrier switches

Nokia Siemens Networks’ carrier-grade cost-effective Carrier Ethernet switches provide scalable traffic-engineered Ethernet services delivery capabilities while emphasizing simple operation and network administration.
DSLAM

This family of ATM and IP DSLAMs brings up to 100Mbps to the end user on existing copper infrastructure – carrier-grade without compromises.
DWDM – economic bandwidth expansion

For many operators, boosting traffic volume by aggressively introducing new services is an important way to increase revenue. What’s needed is a scalable DWDM system that offers short implementation time and easy operation.

IP Connectivity

The IP networking business line within IP Transport also offers a comprehensive range of carrier-grade IP network solutions covering Core, Edge, BRAS and multi-service routers, and will continue to provide IP Connectivity solutions for telecommunications evolution with best-of-breed partner products.
Microwave Radio – decoupling cost from capacity

The MWR business line within IP Transport is also in a strong position to become number one in the global microwave radio market in all application segments of mobile, fixed and utilities – with both ETSI and ANSI standards and a proposed broad portfolio of PDH and SDH access, SDH trunk and point-to-multipoint products.
Narrowband / Multiservice solutions

These solutions are for both CSPs and dedicated network operators. They are designed to deliver true multi service capabilities and to support a very wide range of legacy voice and data interfaces.
Next Gen Metro

Under Next Generation Metro, IP Transport has a complete and scalable Next Generation SDH Multi-service provisioning platform (MSPP) and packet transport portfolio. Our worldwide footprint consists of more than 16,000 MSPP systems deployed and running and more than 100 customers in more than 70 countries.
2.8.2 Network Management & OSS
OSS connectivity management

OSS connectivity management integrates different access technologies under a single, intelligent management solution, freeing maintenance resources to be deployed elsewhere.

Share – Technical Support Portal

Introducing Nokia Siemens Networks Share – the new OSS/BSS support forum and community

Sometimes it’s nice to have a little help.

Maybe it’s an error message you’ve never seen before. Or you need a good starting point for troubleshooting. Or you want to make a suggestion that will make the product work better – and everyone’s job easier – in the future.

But the person helping you needs to speak your language. They need to know what you mean when you talk about a CNXDCNMX configuration, tracing an RNC link or copying a CCMA tree. Without deep technical knowledge, any help is bound to be incomplete and leave you frustrated.

These are just some of the reason to use Nokia Siemens Networks Share, the support forum and community for Nokia Siemens Networks OSS and BSS products.

The idea behind Share is simple: bring together everyday users and product experts in one online forum where you can ask questions and share your knowledge.
Serve at Once Traffica

Traffica provides real-time visibility of end-user activity across the whole network – right down to the cell level – by collecting detailed information directly from network elements.

Yet Traffica is far more than a data collection and service quality monitoring system. Innovative applications can be built on top of Traffica to support every area of the business.

 Converged Core:

Consumer and business VoIP Fixed Softswitching
IMS
Intelligent Packet core
Mobile softswitching
Mobile switching
One Voice Initiative
Rich Communication Suite
Subscriber management evolution
Subscriber data management

Solutions:

CSPs face a number of big challenges in meeting the needs of customers and staying ahead of the competition. Even in these difficult economic times, we can help you gain market-share and improve profitability by offering the most attractive services to your customers. Drawing on our field-proven ideas, innovations and solutions, we are committed to helping you improve the efficiency and profitability of your business.

Broadband & Transport
Core Networks
Service Management & Charging
Wireless Access
Network resource management

Public & Corporate Solutions

At Public and Corporate Solutions, we provide specialist communications solutions for customers beyond the telecommunications industry.
Government Solutions
Railway Solutions
More about Public and corporate solutions
Mobile Backhaul
Integrated Provisioning
Outsourcing
Unified charging & billing
Prepaid and top-up
WCDMA Frequency Reframing Solution
OSS Middleware

 Communications Service Providers
Broadband & Transport
Service Management & Charging
Wireless Access
Network resource management

 Network implementation

Effectively planning, deploying and executing networks globally

Network Implementation offers a wide range of deployment solutions for operators that want to build, expand or modernize a communications network. Proposed deployment solutions can include project management, network design, logistics, site acquisition, construction works and implementation services depending on the scope of deployment.

The main Network Implementation solutions – Managed Deployment, Network Build, Network Consolidation, Turnkey and Outside Plant – have all been tailored to meet the needs of operators in different markets, during different phases of the business lifecycle.

Managing the risk of network deployment through fully outsourced deployment activities for green field operators building presence in new areas (Turnkey and Outside Plant solutions)
Implementation services for established operators that wish to optimize spending and focus on core business while expanding their network or introducing new end-user services (Network Build solution)
Helping experienced operators make the most of their network investments through development and implementation of a network evolution path and modernization activities (Network Consolidation solution)
Partner with mature operators in their ambition to lower OPEX through the introduction of standardized and centralized deployment concepts or simply through the outsourcing of their network deployment organization (Managed Deployment and Turnkey solutions)

The objective of the Network Implementation solutions is to help operators speed up the time to commercial launches and to provide cost-effective implementation solutions that lower the lifetime cost of their network ownership in terms of both CAPEX and OPEX. With joint presence in 120+ countries, more than 4,000 combined professionals in-house and experience from more than 500 combined deployment projects worldwide, Network Implementation has the mindset, resources, expertise and experience to really make a difference.
  Security:

Comprehensive security solutions tailored to your business
Security threats in the mobile world

With the world becoming increasingly connected, protecting your data is a key issue – and one that now affects the mobile world.

New types of virus have been developed specifically to attack mobile systems, leading to data loss, access violations, malfunctions and downtime. These security attacks and fraud can cost you money and customers.
  The value of security

A secure network does not just protect you from threats – it also allows you to offer new services to your customers.

Mobile operators agree that customers, especially businesses, value secure services – and are willing to pay for them. Security services will soon be a key revenue generator for mobile operators.
  Our security experience

We have the knowledge to help you offer your customers these valuable secure services, while protecting yourself from security threats. We offer extensive experience from over 100 security projects and a combination of telecoms, IT and security know-how.

Understanding your specific problems and fixing them helps us to relieve the pain to deliver Real Business results.
Tailored protection – with Real Business Insights

We tailor our services to your needs, finding the best combination of technology and knowledge. Our security services work to find the most efficient and effective means of securing your network.

We use a range of tests and analyses to find the gaps in your security and identify the threats relevant to your network and business. We then help you design and implement security strategies, processes and policies.
  Real Security

We provide a whole range of turnkey solutions and packages of hardware, software and services designed to improve security. Comprehensive security solutions tailored to your business
Channel Partner Program

A global program – providing local excellence

The Channel Partner Program delivers high performance and service quality to customers. It combines Nokia Siemens Networks’ global technology leadership and support with the local expertise and market understanding of our channel partners.

The partners we choose to work with have proven capability, assessed according to our high quality and reliability standards, and are well positioned to develop and implement the solutions that customers really need. The results are carrier-grade communications networks enhancing operational efficiency and safety.

For partners, our co-operative framework offers a best-of-breed technology portfolio, support, training and exclusive use of the Nokia Siemens Networks brand.
Our customers

We work with partners in four major market areas: Utilities*, Transportation, Public Sector and Enterprises.

For customers in these markets telecommunications is not the core (revenue generating) business, but reliable communications are still essential to support mission-critical activities. Customers require their own, dedicated networks because public networks are either non-existent or unable to deliver the required bandwidth, network availability, service quality or security.

 Nokia Siemens Networks Care – Always connected

Operators are concerned to achieve the best possible quality and performance of their networks and to give their users maximum availability of services and applications

Nokia Siemens Networks’ Care process helps meet these ambitions by helping operators to maintain the availability and performance of their networks end-to-end. It does this by providing efficient after-sales services. These range from Classic Care services such as answering technical queries and providing emergency support and hardware repairs, to the innovative Connected Care offering based on the philosophy of “performance protection through avoidance”.

Using a solutions approach, the challenges facing an operator are analyzed and then matched to appropriate services, ensuring that operators get a customized maintenance solution that is a perfect match to their business needs.

Teaming up with Nokia Siemens Networks Care means that operators’ customers are always connected. It also means that operators can get everything they need, from a small set of classic maintenance services up to entirely Managed Care offerings where Nokia Siemens Networks takes care of entire functionalities.

In addition to the traditional maintenance services for software and hardware, Nokia Siemens Networks also provides competence development services. These identify competence development needs and create customized learning solutions to allow the operator’s staff to reach their full potential as technologies and markets change.

The Nokia Siemens Networks Care organization is worldwide distributed and has 6,000 world-class experts around the world, providing high technical and methodological expertise in new service launches and service management, for both Nokia Siemens Networks and third-party products.

Building long-lasting professional relationships with operators is a major pillar of our operations. This is reflected in Nokia Siemens Networks’ Extended Care offering, which continues to support products that have been discontinued and so extend their life span.

With its Care services, Nokia Siemens Networks proves itself a reliable partner with efficient processes, a flexible portfolio and innovative answers to the challenges of today and tomorrow.
  Accelerate towards higher profitability

To help Communication Service Provides (CSPs) make the most of market opportunities, we offer a unique way to transform, accelerate and drive their business forward.

“Fresh & new look at industry. Raised a lot of questions how to tackle the markets in future…This material made clear that we have missed some items in our planning.”

Feedback from a workshop focused on helping CSPs analyze their positioning and build a transformation roadmap.

With our collaborative methodology, we provide the expertise, experience and practical tools to help optimize their evolution while keeping the focus on customer experience and satisfaction.
Roadmap for business acceleration – collaborative way of working

The defining idea is to help CSPs identify the ideal position in the markets – and then uncover the best route to get there. Profitably and with a sustainable business case.
Analyze to identify the market reality

Working together, we examine how CSPs are positioned in the business ecosystem. Exploring the many strategic options available in today’s industry, we analyze which roles are most likely to let CSPs differentiate and achieve their business objectives.
Innovate for the top position

Time-to-market at the right time is the key.

There are always new opportunities in the market. Innovating together can be an eye-opening experience.

 Transform for a competitive advantage

Based on an understanding of likely future scenarios, CSPs can implement profitable business models and opportunities emerging in the changing markets. CSP transformation roadmaps are based on deep understanding.

Accelerate for business success

Working together, we create business acceleration roadmaps for our customers. Our approach is all about discovering the best route to the optimal market position to achieve business success.

Recent Customer successes:

At Nokia Siemens Networks, we help communications service providers build more valuable customer relationships. Below are some recent highlights of our customers’ successes.
2.16.1 Vodafone achieve OpEx reduction by streamlining MMS hosting center:

As sole supplier of Vodafone’s MMS Hosting Center in Milan, Nokia Siemens Networks has deployed an innovative platform using standard hardware and the industry’s leading MMS Center to upgrade the center’s capabilities, reduce operational costs and meet future demands. The upgrade was achieved with no disruption to MMS services for up to 100 million Vodafone subscribers worldwide.
2.16.2 Belgacom TV and Nokia Siemens Networks – a partnership of trust

Belgacom’s vision is to drive and grow the market with innovation, and a core attribute is Belgacom TV. A trusted partnership with Nokia Siemens Networks helped Belgacom realize their vision with IPTV, and the flexible, open platform has prepared them to become a multi-screen TV pioneer, offering an enriched customer TV experience.

DFCA spectral efficiency feature more than doubled the BTS site capacity to meet booming Indian demand:

With a subscriber base growing by more than 3 million per month and a restricted spectrum allocation, one GSM service provider in the Indian market needed a cost-effective way to maintain its quality of service and accommodate the growing subscriber base without resorting to a large-scale deployment of new sites.

 Corporate Responsibility:

In our corporate responsibility activities, we essentially seek to “do the right thing” by three key stakeholders: our employees, our customers, and the planet. We want to maintain an active and open dialogue with many more entities to improve our performance and find new and better ways to serve our key stakeholders.

We want our corporate responsibility actions and our motives for doing them to be honest and transparent. Our primary responsibility is to target growth and profitability; we need ensure the future of our operations. To succeed, we must intertwine corporate responsibility and our business – either to support our existing business objectives, or even to make new business with it. When we run a successful business, we can extend our sustainability thinking also outside of our company; to our customers, our industry and beyond.

This thinking is demonstrated in our three point corporate responsibility plan:

Mitigate corporate responsibility risks: the foundation of corporate responsibility is to respect all relevant laws and regulations and international standards, and create an organization where ethical business practice is a source of pride and push for high ethical standards in our supply chain.
Minimize our environmental impact: reduce our footprint and help our customers reduce theirs.

Maximize our positive impact: use our core competencies beyond our industry sector for environmental benefit, contribute positively in the communities where we are present and fight corruption to the benefit of all.

 Training & Learning:

Competencies are crucial building blocks to achieve business success. With Nokia Siemens Networks, you can ensure your network is being effectively managed by competent personnel which improves subscriber experience, decreases churn and leads to added revenue.

 Nokia Siemens Networks can help you:

gain a better understanding of training needs
make the most out of your network investment and lower your operating costs
optimize competence development in a multi-supplier environment
achieve better visibility into the return on your training investments
increase your ability to concentrate on core business activities

With optimized solutions, processes and people management you gain improved allocation of staff resources, operational efficiencies and job satisfaction. You can achieve a better match for your requirements and more focused learning with tailored, modular and task-oriented competence development packages.

You can realize the full potential of your personnel resources as technologies and markets change with Nokia Siemens Network’s learning.

PART: III

introduction of research project

 Background of the Study

Regardless of what the business is, vendors play a key role in the success of business. Good practices of vendor management will build a mutually strong relationship with vendors which will strengthen company’s overall performance in the marketplace. Ignoring these sound vendor management principles will result in a dysfunctional relationship that will have the potential to negatively impact business.

The time, money and energy used to nurture a positive vendor relationship cannot be measured directly against the company’s bottom line. However, a well managed vendor relationship will result in increased customer satisfaction, reduced costs, better quality, and better service from the vendor. When and if problems arise, rest assured that a well managed vendor will be quick to remedy the situation

Vendor management covers the whole cycle starting from vendor selection to the end, payment after receiving the goods. A servicer providing organization like Nokia Siemens Networks Bangladesh Limited needs to deal will lots of vendors for its purchase of direct and indirect goods and services. Nokia Siemens Networks Bangladesh Limited already have a very well instructed polices for vendor management

This research paper on “Critical Analysis of Vendor Management System” will explain the way the go through and also provide some recommendation for better management of vendors. Though Nokia Siemens Networks Limited in its four years of business life have not conducted research on vendor management system but the preliminary objective of doing this research is to fulfillment of MBA course requirement

This study will have both practical and academic value, as there is dearth of research in this area in Bangladesh, this study will add to the existing knowledge. On the other hand the finding of this study will help policy makers for taking appropriate measure.

Research Problem

For running the business every organization go for purchase of direct and indirect products. For this purpose organization have deal with different types of vendors.

Selecting, contracting, negotiating and managing those vendors cover an important part of business. Furthermore, good vendor management system helps to build good relationship with vendors along with saving of cost and time which affect the profitability of the organization. To know how the organization select and deal with its vendors? How is the perception of vendors towards the organization as a customer? What do both party thinks may improve the relationship? And what is its impact on business? This research will find out the key points for better management of vendors.

 Problem Statement

To critically analyze the vendor management system of Nokia Siemens Networks Limited and its impact on its business.

Origin of the Report

To develop the ability to transform the theoretical knowledge and understanding obtained from the course in practice and to experience the real life situation, the report wa assigned by my supervisor Major AHM Yeaseen Chowdhury. This report can be designated as practical demonstration of the Theories and Practices.

 Objectives of the Study

Broad Objective

The purpose of the study is to have an overall idea about NSN focusing on critical analysis of the total vendor management system and its impact on their business and also to find out way of improving the process.

 Specific Objective

i. To show the global practice of vendor management process

ii. To give a generalize idea of vendor management system for direct and indirect procurement of NSN BD Ltd.

iii. To analyze the process of ordering product using MyOrder tools in indirect procurement process.

iv. To analyze the Invoice payment system for direct and indirect purchase

v. To find out whether NSN deals with its vendor as a strategic partner

vi. To find out whether there is any relationship between the state of current practice and vendor development.

vii. To find out whether NSN as a green company chose those supplier who produces environment friendly goods and services or not.

viii. To find out whether there is any change in cycle time for procurement of a product or not

ix. To find out the growth rate of purchase of any particular product

x. To find out the rate of implementation of contract in the case of service contract with third party.

xi. To show the vendors perception towards NSN as a customer.

xii. To show the impact of vendor management system on business of NSN BD LTD.

Research Questions and Justifications

Research Question-1

How employees of NSN using MyOrder tools as the best way of ordering and purchasing a product in the case of indirect procurement?

Justification: Purchasing indirect product for office uses is crucial for an organization like NSN, where latest technological electronic product and software’s are purchased as per employees requisition along with other regular product. The question regarding the order and purchase process will help NSN to identify if there is any scope of improvement in this process.

Research Question-2

How NSN process their invoice payments for their vendors?

Justification: To get better output from vendor maintaining a good relationship is very important. For that payment system is one of the most important parts for vendor management. On time payment and shorter credit period is better for vendor, but longer period is better for NSN, this question will clarify how they balance the interest of both party.

Research Question-3

Does NSN BD Ltd. deals with its vendor as strategic partner? and works for vendor development?

Justification: In this widely competitive business world vendor/ Supplier development is one of the most important job for a service oriented organization like NSN. They depend largely on the contractor for installation service which is very important.

Research Question-4

Does NSN BD Ltd. deals works for vendor development?

Justification: This will help to find out their level of help in development.

Research Question- 5

Being a green Company, does NSN give importance on Environment friendly goods?

Justification: NSN claims that they are a green company, so choosing environment friendly products is an important issue in case of selecting suppliers.

Research Question-6

Is there any change in cycle time for procurement of a product in a year?

Justification: Decrease in cycle time in procurement of product shows the increase in efficiency in procurement, which saves time and cost.

Research Question-7

Is rate of purchase increasing?

Justification: Increase in purchase reflects that there is growth in business both in the case of direct and indirect procurement.

Research Question- 8

Does NSN BD successfully implement the entire contract in the case of service contract with third party?

Justification: the successful implementation of contracts shows that of contract their selection of supplier, preparation and management of contracts is efficient

Research Question- 9

What is the vendor’s perception towards NSN as a customer?

Justification: Vendors perception towards NSN as a customer reflects the relationship between vendor and NSN BD Ltd, this will also help to find out the way of even better relationship with vendor.

Developing Hypothesis

Hypothesis – 1

Null Hypothesis H0: 70% employees think that using my order tolls is the best way for ordering and purchasing indirect products.

Alternative Hypothesis H1: Less than 70% employees think that using my order tolls is the best way for ordering and purchasing indirect products.

Hypothesis – 2

Null Hypothesis H0: 70% employees think that their policy for payment serves the interest of both vendors and organization

Alternative Hypothesis H1: Less than 70% employees think that their policy for payment serves the interest of both vendors and organization

Hypothesis – 3

Null Hypothesis H0: More than 60% of employees say that NSN BD Ltd deal with its vendor as strategic partner

Alternative Hypothesis H1: Less than 60% of employees say that NSN BD Ltd deal with its vendor as strategic partner

Hypothesis – 4

Null Hypothesis H0: There is no significant relationship between good vendor management practice and vendor development

Alternative Hypothesis H1: There is significant relationship between good vendor management practice and vendor development

Hypothesis – 5

Null Hypothesis H0: More than 70% employees of believe that NSN give importance on Environment friendly goods suppliers

Alternative Hypothesis H1: Less than 70% employees of believe that NSN give importance on Environment friendly goods suppliers

Hypothesis – 6

Null Hypothesis H0: More than 75% employees think that Cycle time for procurement of product has decreased more than 7 days each

Alternative Hypothesis H1: Less than 75% employees think that Cycle time for procurement has decreased less than 7 days each year.

Hypothesis – 7

Null Hypothesis H0: More than 70% employees said that purchase rate of NSN is growing more than 15% per year

Alternative Hypothesis H1: Less than 70% employees said that purchase rate of NSN is not growing more than 15% per year

Hypothesis – 8

Null Hypothesis H0: More than 80% employees believe that all the contracts for procurement of NSN BD LTD. have been successfully implemented.

Alternative Hypothesis H1: Less than 80% employees believe that all the contracts for procurement of NSN BD Ltd. have been successfully implemented.

Hypothesis – 9

Null Hypothesis H0: More than 90% vendors think NSN is a good customer for their product (got more than 3 in the scale of 5)

Alternative Hypothesis H1: Less than 90% vendors think NSN is a good customer for their product (got more than 3 in the scale of 5)

Limitations of the Study

We will face some usual constraints during the study. These constraints can be:

Relevant papers and documents were not available with sufficient data.
Enough information was not found because most of the information are confidential and not disclose able to any person except the employees of NSN.
Total business of NSN is system based and except employees no one have the authority to log in to the system so there was comparatively less scope of direct practical exposure
The system software NSN uses is used globally so the contribution of NSN Bangladesh is tough to separate and evaluate.
Their financial reports for NSN BD is prepared just for legal and tax purpose which is confidential.
In spite of my sincerity, some mistakes can be occurred. I admit my responsibility for those inadvertent mistakes, if there will any.

Literature Review:

A number of previous studies (U.S. Bureau of the Census, 1991; Fearon and Bales, 1995) indicate that the role of the Purchasing Department is much smaller in the purchase of nontraditional (non-product related) goods and services than commonly believed. These nontraditional. (non-product related) areas, such as insurance, utilities, consultancy, travel and advertising, are likely to be purchased without the involvement of professional buying practice and skills.

For example, the Center for Advanced Purchasing Studies (CAPS) in a study in 1993 (Fearon and Bales, 1993) found that in a surprisingly large percentage of firms,

the Purchasing Department had no input to the purchase of nontraditional goods and services (e.g. in 39% of the firms, there was no involvement in the purchasing of services, in 55% of the firms there was no involvement in the purchasing of utilities).

Similarly, in another study made in 1995, Center for Advanced Purchasing Studies (CAPS) found that from the total of $ 140.3 billion purchased by the 116 organizations, only 41 percent was spent by the purchasing department, 59 percent was spent outside of the purchasing department. From these 59 percent: 41.55 percent was spent by some other nine departments (transportation, finance, administration, human relations, etc.) and for 17.45 percent the study couldn’t identify the buyers. The research highlights the purchase dollars spend of the total 116 organizations for the largest ten goods and services. The purchasing department apparently had very little input in the purchase of the majority of services and also had a smaller input in the purchase of non-product related goods.

In Michels. view (1996), a purchasing department can be involved in three different ways: (1) purchasing can be directly involved in NPR purchasing; (2) purchasing can act as an internal consultant/advisor for NPR purchase buyers; (3) purchasing can act as a cross functional team member dealing with nontraditional expenditures.

Results of a recent Purchasing Magazine survey of 1000 corporate buyers nationwide show

that purchasing departments take on many activities for service procurement that were once left to the using departments. From a total of 1000 respondents: 70 percent were involved in contract negotiations; 63 percent were involved in supplier selection; 58 percent were involved in contract management; and 5 percent were involved in setting specifications.

As the study shows, the purchasing department has become more involve in the tactical

procurement of NPR goods and services. Apparently, these purchasing departments have started to realize that there are numerous opportunities in the NPR procurement and that they have the skills and expertise to ensure that the company receives the best value. While benefits of involving purchasing department in the NPR purchasing process may be numerous there are also several major challenges of involving purchasing department in the NPR procurement

Summarizing, the literature suggests that:

Purchasings’ involvement in NPR is still very limited and problematic;
involvement could offer many advantages, including offering increased control to top management;
Purchasing involvement is subject to horizontal resistance and vertical ignorance.

In other words: top management does not seem to actively use the purchasing department as a means for keeping sufficient control on NPR purchasing. In order to get a better understanding of how purchasing’s involvement comes about, we attempt to transfer some basic insights from (inter-) organizational theory on the topic of organizing NPR purchasing. The strategic importance of vendor selection and subsequent assessment is well established in the literature of business purchasing, beginning with the seminal work on vendor selection criteria published in 1966 (Weber, 1996). Significant research continues to be done on this topic in part because of its particular relevance to manufacturers in a just-in-time environment where vendor price, quality, and delivery are key performance criteria. There are even numerous trade journals and scholarly journals devoted to vendor relations and performance evaluation. Among them are Supply Management, Materials Management and Distribution, Journal of Supply Chain Management, and Summit (a Canadian magazine about public sector purchasing).

Weber describes the three common and flawed current approaches to vendor evaluation (1996). First is the “categorical or key-factor rating method” in which potential vendors are assigned subjective, largely intuitive, ratings based on the evaluator’s judgment and experience. A second current method is the complex “cost-ratio method” which requires a comprehensive, precise cost-accounting system to determine the buyer’s internal operating costs associated with the vendor’s quality, delivery, and service. The third common approach, the “linear average or weighted-point method,” modifies the first method by providing numerical weights to the subjective evaluation criteria

Many other approaches have been described and proposed in the literature. Researchers have suggested using more objective quantitative approaches, including mathematical programming models, statistical approaches, and analytical hierarchical processing. Weber, for instance, demonstrated the use of a mathematical programming model employing data envelopment analysis to measure vendor performance on multiple criteria and to identify comparative benchmark values (1996, p.28; see also Talluri, Narasimhan, & Nair, 2006, p.212). Dogan and Sahin employed mathematical models to select vendors using activity-based costing and fuzzy present-worth techniques (2003, p.420). Babu and Sharma gave an example of analytical hierarchy processing (2005, p.101). Still other researchers proposed methods which combine both objective and subjective data. An example is Li, Fun, & Hung, who used two-dimensional analysis to propose a performance measure based on both quantitative and qualitative criteria (1997, p.753). Going the opposite direction are other research groups which proposed vendor performance measurements based on an evolutionary fuzzy system for evaluating attributes described linguistically (Ohdar & Ray, 2004, p.723; Jain, Tiwari, & Chan, 2004, p.735).

Given the vast array of approaches to vendor evaluation and the fact that no single evaluation method is completely satisfactory, there is now research relating to strategies for choosing an evaluation technique. Purdy and Safayeni discuss the advantages and limitations of a variety of methods for evaluating potential and current suppliers, and they classify the methods by whether the focus is on information from product- or process-based domains and whether the information acquisition mode is direct or indirect (2000, p.435). They posit that buyers normally must use indirect methods for evaluation of potential vendors and that buyers should use methods in all four categories once a vendor relationship has been established (p.441).

Vendor evaluation strategies exist within the context of an organization and its processes. Choosing an assessment approach is just one of the seven steps of a process of developing and deploying vendor assessment outlined by Gordon (2005, p.20). Although this article is found in a trade press, it includes a useful bibliography of books about supplier evaluation and managing relationships with suppliers. Another aspect to consider is that many of the assessment techniques require technological tools such as software packages. Examples of descriptions of such software implementations were provided by Choy, Lee, and Lo (2004, p.191), by Humphreys, Huang, and Cadden (2005, p.147), and by Lau et al. (2005, p.61).

RESEARCH METHODOLOGY

Methodology of the Study

The report will be based on both primary and secondary data that we will collect from various sources. The details of all the books and journals that will use in this report will be shown in the bibliography.

 Primary Source of Data Collections:

I will have practical participation in these job related areas like Procurement Department and Finance and control department. Interview with the employees of other and department related to the topic and survey of employees

Secondary Source of Data Collections:

Websites
Different publications and journals
Different repots

 Scope of the Study

The focus of this report will be based on the activities of procurement of product and service of NSN Bangladesh Ltd. It will cover both the direct and the indirect procurement process only for those products for which NSN BD directly takes its decisions of vendor assessment and selection, purchasing process and payment system of NSN Bangladesh. This report will not cover that part of procurement where decisions are made globally. In case showing impact of vendor management on its business, the impact of cost saving in direct and indirect procurement on the profitability of Nokia Siemens Networks Limited.

Research Design

Type of Study

A descriptive research will be designed and structured questionnaires were developed for conducting surveys. Questionnaire survey and face to face interview technique was used for employees of NSN BD Ltd. On the other hand, telephone survey and also personal interview technique is used for vendor’s survey. Some factors such as time, money, difficulty in survey of vendor will influence the research design.

Basic Research Method

Basically the research has done under survey method. An experimental method will very costly.

For doing this survey based report at first I have gone through previously published reports relevant to my topic to find out the key points for the research and then went for exploratory research buy talking to the employees working in this field. Doing this exploratory research I have generated the idea about the hypothetical means I have taken for the research.

Sampling plan

 Target Population

The target population for this research would be the all the employees on NSN BD focusing on the employees directly involved with the total vendor management system, and the vendors who supplies the product or service for NSN

 Sampling process

For the employees of NSN as the population is known, the employees of NSN BD Ltd. are divided into two strata’s. In one strata there are employees who are working in technical side and not related directly or indirectly with the system of vendor management (Service Unit) and the other one is the employees directly or indirectly related (CT unit, SSM, F&C, HR, IT, WME, OML) with the process simple random sampling is good and for the vendors as it is tough to get the of population as NSN BD Ltd. purchase a wide range of products inside and outside of the country. So it was not possible to know the number of vendor of NSN BD Ltd.

 Determination of sample size for NSN BD employees:

Using appropriate formula that means the proportion it can be found out as determined follows:

NpqZ2

n =

Nd2 + Z2pq

Where,

N= Population size

n = Sample size

p = estimated population proportion number (50%)

q = 1-p, or estimated proportion of failures

d =Precision level or magnitude of the error (10%), the maximum error between the true population and the sample proportion

Z = at 95% confidence level (1.96)

40 X .5 X .5 X 1.962

n =

40 X 0.052 + 1.962 X .5 X .5

=29.7

≡ 30

So here the sample taken size is 30 (round figure)

 Sample size for vendors:

Where population size is unknown

Confidence level = 80%

Level of precision = 10

40.96

41 (rounded)

The population size of NSN BD LTD is unknown, so from the above calculation the sample size found is 41, but it is really tough to conduct survey of vendors. Here non probabilistic convenient sampling is done, and for the vendor the convenience sample size is 10 as NSN BD permitted to contract.

Measurement and Scaling Process

In order to analyze data some measurement and scaling procedure is used. Two types of scales such as nominal and ordinal scale are used. Nominal scale is used to identify classify objects. Ordinal scale is used to indicate the relative position of the objects. Interval scale is used to differentiate the objects (Attitude and opinion of the customers).

Questionnaire Preparation

A planned questionnaire is very important to do the research. In this case a structured questionnaire was provided by Bata Shoe Company. Due to some statistical analysis difficulty the questionnaire was rephrased a little bit. The questionnaire is prepared by considering following criteria:

Pertinent for research.
Simple language is used.
Leading & loaded questions is avoided.
Easy to understand questions.

 Data Analysis and Interpretation

After collection of all essential data, those are analyzed following ways:

Statistical Analysis: Appropriate statistical tools are used to analyze the data. Number of tools is used for this reason. The primary data from the questionnaire will be placed in SPSS database. Chi Square test, Frequency distribution and arithmetic mean, correlation, regression, Z test and T test is used to analyze data. Cross tabulation is used to find out various relationships with various variables. All these analysis will be done through the use of SPSS for Windows software.

ANALYZING SPECIFIC OBJESTIVES AND TESTING HYPOTHESIS

 Specific Objective: 01

To show the global practice of vendor management system in current days.

To know about recent practice of vendor management system at first we have to know what is vendor management? Vendor management is the system of establishing service, quality, cost, and satisfaction goals and selecting and managing third party companies to consistently meet these goals.

Establishing Goals – Just as employees need clearly established goals, operations need clearly defined performance parameters. When selecting or managing vendors, vendor managers must optimize their opportunity to achieve these goals by using third parties companies.
Selecting Vendors – The fine art of vendor management is essential to optimizing operational results. Different vendors have different strengths and weaknesses, and it is the vendor manager’s responsibility to match the right company with the desired performance characteristics. Failure to consider this comprehensively could lead to complete failure.
Managing Vendors – On a daily basis, vendor managers must monitor performance, provide feedback, champion new projects, define or approve/disapprove change control processes, and develop vendors. There’s a tremendous amount of detail to this aspect of the discipline, and we’ve covered this in many posts here.
Consistently Meet Goals – Operations must perform within statistically acceptable upper and lower control bounds. Everything the vendor manager does should focus on meeting goals, from providing forecasts to defining requirements, from ensuring vendors have adequate staff to ensuring the staff have completed all required training.

Now a day’s vendors are not just treated only as the supplier, they are now a days working like the partners. Most of the organizations in recent days not only dealing with vendors as strategic partner, but also working for their development to ensure smooth flow of product or service. Smooth and on time supply of product also ensures the smooth running of any kind of business.

Furthermore, currently many well known organizations are practicing JIT in their business, which is never possible without a sound vendor management system.

Its importance has increased along with the increased scope in the field of vendor management. It has opened up new scope of business. Now there are some organizations that are doing business by dealing only with the vendors of different organizations. They deal with all types of vendors of those organizations and ensure them there required product and service on time. Those organizations deal with only one organization as their vendor (vendor management firms) which saves time and cost for the organization.

Use of web based vendor management and vendor management software base solutions are available having different features and benefits, these type of solution establish a lower-cost, higher-quality vendor management process through a centralized repository of third-party data, clear reporting of activities related to vendor risk, and a consistent and repeatable assessment process. These solutions facilitate

Management of Vendor Profiles

· Build Vendor Risk Questionnaires
· Complete Vendor Assessments
· Streamline the Management of Assessment Findings
· Report on Your Vendor Risk Profile
Also provides different sorts of benefits like:

Lower Risk, Greater Compliance
Automation
Savings in Time, Effort and Cost
Current, Holistic View
Quick Time to Value
Deployment Flexibility

Few strategies and steps that are now a day’s taken for better vendor management globally are discussed below:

Four Steps to Successful Vendor Management:

Four steps are necessary to appropriately outsource or contract for goods or services:

Step One: Risk Analysis

Fundamentally, proper vendor management is nothing more or less than risk management. This step requires the organizations to identify the importance of the function to the organization, the nature of the activities the vendor will perform, and the inherent riskiness of the activity. The more risky the activity, the more important the need is for diligence in selection, in contracting, and in supervision and monitoring. Of course, for regulatory purposes, the process of risk analysis must be carefully documented.

To properly assess the importance of the function to the organization, it must first analyze how the outsourced function meets the business needs and strategic objectives. What would be the effect on the institution if the function failed or was not adequately performed? Will outsourcing this function cause dependency on the third-party provider for an essential function? Are there other potential vendors that could quickly provide the same service if the current vendor fails? Is the organizations are able to adequately oversee this outsourced function?

Step Two: Due Diligence in Vendor Selection

The intensity of due diligence required in selecting a vendor will depend on the results of the risk analysis the organizations completed in deciding to contract with a vendor to provide goods or services. Due diligence requires a reasonable inquiry into a vendor’s ability to operationally meet the requirements for the proposed service and an inquiry into the vendor’s financial ability to deliver on its promise.

Financial institutions should also question operational issues such as staffing, expertise, and the vendor’s internal controls.

Assessing staffing requires questions such as:

What is the quality and experience of the staff?
Are there sufficient employees to meet the financial institution’s expectations for performance?
Are the managers competent and familiar with the industry?
Are employees and management well trained?
Does the staff turnover quickly or is it stable?

Assessing industry expertise requires questions such as:

How long has the vendor been involved in providing this service?
Does the vendor provide this service to other financial institutions?
Are there user groups or references that the bank can consult concerning quality?
How do these references assess the quality of service performed by the vendor?
Does the vendor rely on third parties or partners to provide the services?
Does the vendor have information concerning the expertise of these third parties?
What is the reputation of the business?
Has the vendor been involved in litigation that casts doubt on its ability to provide the services in the manner required by the bank?
Is the vendor aware of any bank regulatory requirements and other legal requirements relating to its goods or services?

Depending on the organization’s risk analysis, it should consider on-site visits. If the vendor is geographically distant, will that distance affect the cost or quality of service?

Organizations should also analyze the vendor’s operations and controls. Some questions to be ask include:

What are the vendor’s security precautions concerning the bank or bank customer’s confidential information?
What are the service provider’s standards, policies, and procedures relating to internal controls, record maintenance, background checks on employees, and physical security of its operations?
What kind of internal audit is performed at the vendor?
Are there internal audit reports or internal control evaluations available for review by the bank?
Does the vendor have contingency plans in place?
Are those plans adequate?

In performing its due diligence, the financial institution must consider the financial condition of the vendor. It should analyze any available audited financial statements. If audited financial statements are not available, the vendor’s most recent and year-end balance sheet and income statements should be examined.

If adequate financial information is not available for the vendor, the lack of information should be considered a risk in the assessment of the vendor. In addition to financial information, the existence and adequacy of insurance coverage should also be questioned. Does the vendor have fidelity bond coverage, liability coverage, fire, data loss, document protection, and other coverage in amounts deemed adequate for the services the vendor is to perform? Will the bank’s contract with the vendor require the vendor to make additional investments in personnel or equipment? Can the vendor easily absorb any such additional investment?

Step Three: Documenting the Vendor Relationship Contract Issues

A strong contract with a significant vendor is essential to properly managing the relationship. Even relationships with vendors that provide low-risk services can, and often should, be defined in simple form contracts.

All contracts should be in writing and, to the extent applicable, should cover expectations and responsibilities, the scope of work and fees, type and frequency of reporting on the status of work involved, process for changing scope of work, ownership of any work product, an acknowledgement that the vendor is subject to regulatory review, privacy and information security, a process for ongoing monitoring, and supervision and dispute resolution. Legal counsel should review all significant contracts.

A common problem with many vendor contracts is that the expectations and responsibilities of the vendor and the financial institution are not adequately communicated. When problems develop, resolution becomes very difficult, as each party insists that the other is responsible.

The scope of services to be performed should be carefully addressed in the contract. Scope should, at a minimum, include:

Services to be performed by the vendor
Responsibilities of the financial institution
Timeframes
Implementation activities
Details concerning fees
The financial institution’s responsibility for expenses incurred by the vendor

Performance standards should likewise be included in the contract. What tolerance does the financial institution have for errors?

If the contract is a technology contract, a service level agreement (SLA) is essential. An SLA will establish the performance standard and service quality expected under the agreement. For each service covered by the SLA, it should provide for an acceptable range of service quality, a definition of what is being measured, a formula for calculating the measurement, and penalties (or credits) for meeting or exceeding targets.

Vendor contracts must also include references to the organization’s right to monitor the performance and condition of the vendor. It should require the vendor to submit appropriate reports, including financial reports, audit reports, and internal control reports, depending on the risk assessment for the subject of the contract.

The term of the contract is another essential factor. The regulators are increasingly clear that they are concerned about the use of long-term contracts, especially in technology agreements. Technology changes rapidly and organizations need the flexibility to change providers if the chosen vendor fails to keep up with current practices.

Step Four: Ongoing Supervision and Monitoring of Vendors

An organization must provide in its contracts for the ability to monitor vendors during the term of the contract. To adequately supervise a vendor, an officer must review and be accountable for the performance of the vendor. How much supervision is required is, of course, dependent on the institution’s assessment of the risk of the particular service being provided. The staff assigned to oversee each vendor should have the necessary expertise to do so appropriately.

Monitoring and supervision should include ongoing (at least annual) review of the vendor’s financial condition and insurance coverage, including a verification that the insurance coverage represented to the bank are in force. The vendor’s policies relating to internal controls and security should be reviewed and some method of determining whether the vendor is following such controls should be developed.

Review and monitoring also requires an assessment of whether the third party has provided services in accordance with representations made in the contract and in accordance with applicable regulations and laws. The vendor’s contingency plans should be reviewed to be certain that they remain in place and have been adequately tested.

Document, Document, Document

The true purpose of a vendor management program is to maintain quality vendors and quality relationships with those vendors to operate the financial institution efficiently and well.

In addition to that purpose, each financial institution must prove to its regulator that vendors are managed efficiently and well. As compliance officers know, to satisfy regulators, documentation is paramount. Document the risk analysis engaged in at the time a decision is made to engage a vendor. Document the due diligence performed. Require effective contracts and maintain up-to-date versions of the contracts (complete with all amendments) in a place where the bank and examiners can easily review them. Document the process of monitoring and reviewing each vendor’s performance. Report significant vendor relationships to the board of directors on at least an annual basis.

Vendor management is complex and indeed cumbersome and annoying. Properly implemented, however, it can save the financial institution money, loss of reputation, failing to provide core services in a quality manner, and regulatory headaches.

Many variables make navigating outsourcing contracts challenging and confusing. Contract reviews are detailed assessments of a potential or existing contract’s favorability for a company. They are useful in determining whether the deal is advisable, what are the best areas to focus on while signing up for renewal, and which contracts can be exited most easily during a Vendor consolidation.

Contract reviews facilitates new deals, re-negotiations, and exiting relationships. For existing contracts, timely contract reviews help in assessing the contract performance and identifying the areas of improvement/opportunities/potential threats that determine the favorability of the contract. The provision for periodic contract review is essential for longer engagements. This provides an option to fine tune your baseline and optimize your spends based on actual utilization and changing market trends.

On the other hand, a new contract review assists in effectively comparing solution offerings of different vendors and selecting the right vendor. An experienced Sourcing Advisor can aid in taking a more selective sourcing approach that meets specific objectives while maximizing savings.

Points to Consider While Reviewing Contracts

Solution Competitiveness – When there is more than one competitive bid, which one is best for you?
Price Competitiveness – Is the deal fair financially when compared to market pricing?
Accuracy of Scope – Is the contract scope in line with your business and financial objectives. Example: mix of services, delivery vehicles, and level of services.
Appropriate Service Levels – Are the service levels fair, measurable, and enforceable?
Terms and Conditions – Are the all terms and clauses, like exit clauses, favorable? Are any important clauses missing?
Service Delivery Platform – Is the technology and delivery architecture used by the vendor to provide services aligned with contract standards?
Others – Are there any missing items or anything misleading? Example: scope mismatch between financial proposal and technical proposal, etc.

In managing vendors, contract management is one of the most important step, negotiation and renegotiation is required so many times in business. Currently the best Practices for Smooth Contract Renegotiation consist of some clear rules are widely appreciated.

Rule: 1. Be very clear about your Business intentions

You should be aware of all the aspects of the deal and should have a detailed understanding of your business requirements so that relevant levers in the agreement can be pulled, to achieve the stated objectives. That means spending ample time with your business leaders for understanding their needs; synthesizing their input; and translating those needs into a set of goals that need to be achieved through renegotiation.

Rule: 2. Evaluate Contract Performance

Review performance levels both internally and with the vendor. Determine whether the intended objectives have been achieved or not, and if not, why not. Bring out the points of concern in the renegotiation meetings with your vendor. The success or failure of an Outsourcing Contract is dependent on effective vendor management and the governance structures which have been put in place.

Rule: 3. Have Clear Rules of Engagement

Set out and agree clear rules with your vendor before you start the re-negotiation process. These should include a charter of behaviors and principles to be applied throughout the process, the number of senior-level people to be involved from client and vendor side, and a timeline for calling off the renegotiation process.

Rule: 4. Avoid hastily negotiating a Contract

You should be armed with plenty of facts and figures to make your business case. Do a detailed review of your services and have a clear picture in mind as to what are the business objectives that are to be achieved through this contract. Work on a collaborative discussion with your Vendor that brings out your concerns and goals as well as ways to manage them.

Rule: 5. Bring an Appropriate Team for the Re-negotiations

Do not re-negotiate a contract using only the account, service management and governance team on both sides. They are typically focused on short term issues and actions; and lack the executive mindset and big-picture view. Your team should be aware of your wider business needs, and not just immediate requirements. Hence identify and engage a corporate leader to act as the focal point for your negotiating team. Also ensure that your Service Provider’s corporate team is aware of your goals and is engaged at every step of the process.

Rule: 6. Extend Your Contract

If criteria such as end-user satisfaction and service level agreements are being met, and the contract is meeting your needs, the agreement with your existing service provider can be extended. However you still need to figure out latest developments and important amendments and build them into your existing contract. A rigorous external benchmarking exercise is critical to achieve this understanding. An Advisor can help you negotiate the best extension with their in-depth market insight and benchmarking experience.

Rule: 7. Contract Termination

The cancellation of an Outsourcing Agreement may happen due to following reasons:

Your existing Provider has failed to deliver particular services to your satisfaction
Commitments of process improvement and efficiency not being honored
Your requirements have changed to such an extent that a vendor with a different set of services and areas of expertise is now required

In the event of a Contract being terminated, you can exercise a number of options:

Bring in an Advisor to guide you on ‘Exit’ Strategy’, ‘Risk Identification & Mitigation’· Transfer whole or a part of your Outsourced services to a different Provider
Keep your existing Service Provider in some capacity
Bring some of the Outsourced services back in-house – here you need to determine if you have the right infrastructure and team in place to support such a move
Enter into a new contract

Specific Objective: 02

To give a generalize idea of vendor management system for direct and indirect procurement of NSN BD Ltd.

Nokia Siemens Networks generally deals with three types of vendors those are for

Indirect purchasing

2. Internal purchasing
3. Direct purchasing

Figure 01: General work flow for all types of purchase and vendor management

General work flow for all types of purchase and vendor management

Category groups of products generally purchase     

  • Facility Services
  • IT Terminals, Testing and Manufacturing
  • Equipments
  • Logistics Services
  • Professional Services
  • Travel & Fleet

All these materials, services and software are usually charged to the following accounts:

  • Cost centers,
  • Fixed assets, capital investments
  • WBS elements.

Nokia Siemens Networks

Some are parts:

Nokia Siemens Networks (Part 1)

Nokia Siemens Networks (Part 2)

read more
EEE

Report on Building Aspects of Electric Substation

Introduction

A substation is a component of an electricity transmission or distribution system where voltage is transformed  from  high   to   low, or  the  reverse,  using   transformers.  A  transmission   substation transforms the voltage   to a level suitable for transporting electric power over long distances. This is   to  minimize capital   and   operating   costs   of the  system. Once it  is transported close to where it Is   needed,   a   distribution  substation transforms the voltage to a  level suitable   for   the  distribution system. So the   assembly  of  apparatus   used  to  change  some  characteristic of  electric  supply   is called a substation In   a substation   using   step   up   and step down   transformer change   AC voltages   from   one   level   to

Another,   change   AC   to   DC   or   DC   to   AC.   A   substation   may   have   one   or   more   relates transformers, many protective equipment and switches.

Substation   is important   part of   power   transmission   and   distribution   system.   Substations   are   the most critical part of any electrical supply grid. A failure of a single piece of substation equipment

can cause   a   total   grid   collapse   which   may   take   days   or even   longer   to   rectify.   The   continuity   of power supply   depends   on successful   operation   of substations. It   is therefore essential   to   exercise

Extreme care while designing and building a substation. Specific functions of substation are-

Power transformer.

Local network   for Connection point.

Switchyard – Bus bars, circuit breakers, disconnections.

Measuring point for control center – Potential and current transformers.

Fuses and other protection device.

Classification of substations:

There are the two most important ways of classifying a substation. According to

1.   Production requirement

2.   Constructional features

According to Production requirement:

A substation   may   be   called   upon to change   voltage   level   or   improve power factor   or   convert ac power   into   dc   power   etc.   According   to   service   requirement      11kV  substation is

Transformer   substation.   In   this   substations   using   power   transformer   changes   voltage   level   of electric supply.

According to constructional features:

A substation   has   many   components   (e.g.   Circuit   breaker, switches, fuses,   instrument   etc.)   Which must   be   housed   properly   to   ensure   continuous   and   reliable   service.   According   to   constructional features the substation is outdoor type Substation.

The outdoor equipment   is   installed   under   the sky.   Outdoor   type   substations   should   be   in   fenced enclosures or located in special-purpose buildings. Indoor   substations are usually found   in   urban

areas   to   reduce   the   noise   from   the   transformers,   for   reasons   of   appearance,   or   to   protect switchgear from extreme climate or pollution conditions                 .

11/.440 kV Substation Arrangement

The   arrangement   of   substations   can   be   done   in   many   ways.   However   the   main   sectors   of arranging the substations are –

 At load center: Where   voltage is   getting down         11kV   to 400volts using transformer   and   this is near to be load center.

Substation Layout

a) Principle of Substation Layouts

Substation   layout   consists   essentially   in   arranging   a   number   of   switch gear   components   in   an ordered pattern governed   by their   function and rules of spatial separation.

b) Spatial Separation

i.    Earth Clearance:   This is   the   clearance between   live parts   and earthed   structures, walls, screens and ground.

ii.   Phase Clearance: This is the clearance between live parts of different phases.

iii. Isolating Distance: This is the clearance between the terminals of an isolator and the connections.

iv. Section Clearance: This is the clearance between live parts and the terminals of a work section. The limits of this work section, or maintenance zone, may be the ground or a platform from which the man works

c) Separation of maintenance zones

Two   methods   are   available   for   separating   equipment   in   a   maintenance   zone   that   has   been isolated and made dead.

i. The provision of a section clearance

ii. Use of an intervening earthed barrier

The choice between   the   two methods   depends   on   the   voltage and whether   horizontal or   vertical clearances are involved.

Equipment   Function

Bus-bar

The incoming and outgoing lines are connected to the   bus- bars.

  • Isolator  Disconnect   a   part   of   the   system   for   general   maintenance  and repair under no load condition for safety.
  • Earthling Switch
  • Discharge the over voltage to earth.
  • Circuit Breaker Which   can   automatic   open   or   close   a   circuit   under   normal   as well as fault condition.
  • Lightning Arrestor   discharge   lightning   over   voltages   and   switching   over voltages to earth.
  • Current Transformer
  • Step down current to know the ratio for   control and protection. Voltage Transformer Step down voltage to know the ratio for control and protection.
  • Series Reactors
  • Reduce the short circuit current or starting current.
  • Line Trap   Prevent high frequency signals during low loads.
  • Shunt capacitors Provide   compensation   to   reactive   loads   of   lagging   power
  • Factors.
  • Shunt Reactor in EHV
  • substations
  • To provide reactive power during low loads.
  • Neutral Grounding Resistor Limit the earth current.

Functions of a Substation

1 – Supply of required electrical power.

2 – Maximum possible coverage o f the supply network.

3 – Maximum security of supply.

4 – Shortest possible fault-duration.

5 – Optimum efficiency of plants and the network.

6 – Supply of electrical power within targeted frequency limits (49.5 Hz and50.5 Hz).

7 – Supply of electrical power within specified voltage limits.

8 – Supply of electrical energy to the consumers at the lowest cost.

Elements of a Substation

Substations   have   one   or   more   transformers,   switching   and   control   equipment.   In   a   substation, circuits breakers are used to interrupt any short-circuit or overload currents that may occur on the

network.   Substations   do   not   usually   have   generators,   although   a   power   plant   may   have   a

substation   nearby.   Other   devices   such   as   power   factor   correction   capacitors,   synchronizer   and voltage   regulators   may   also be located   at a substation.   The   main   equipments   of   a   substation are shown –

11/.440 kV   Substation equipments details

Transmission line   set giving   the   rated voltage   level   up to 11   kV.   This   11 kV lines are connected to the 7MVA transformer via 33 kV bus bars is further connected to LT switchgear.

The   equipment   required   for   a   transformer   Sub- Station   depends   upon   the   type   of   Sub-Station, Service   requirement   and   the degree   of   protection   desired.    11kV Sub-Station      has   the   following major equipments.

Transformer:

      7MVA 33/11Kv Main Transformer,

   4 MVA.3 MVA.2 MVA.&1.5 MVA

2.   Lightning   arrestor

3.   Isolator   and Earth switches

4.   Current Transformer

5.   Potential Transformer

6.   Duplicate type bus bar

7.   Insulators

8.   PFI Plant

9.   LT Switchgear –5000Amps, 4000Amps,3000Amps,2000Amps.1500Amps.all LT Switch Gear are Various ACB

Capture

Faraday’s law of induction, which states that:

The induced electromotive force (EMF) in an y   closed circuit is equal to  the e time rate of change of the magnetic   flux through the circuit. Or alternatively:

The EMF generated is proportional to the rate of change of the magnetic flux.

where   Vs is   the   instantaneous   voltage,   Ns is   the   number   of   turns   in   the   secondary y   coil   and

equals   the   magnetic   flux   through   one   turn    of   the   coil.   If   the   turns   of   the   coil   are   oriented perpendicular   to   the   magnetic   field   lines,   the   flux   is   the   product   of   the   magnetic   flux    density   B and   the area A through which it cuts. The area is constant, being equal to   the cross-sectional area

of   the   transformer   core,   whereas   the   magnetic   field   varies with   time   according   to   the   excitation of   the   primary.   Since   the   same   magnetic   flux    passes   through   both   the   primary   and   secondary coils in an ideal transformer, the instantaneous voltage across the primary y   winding equals

Electrical power is   transmitted from   the primary   circuit   to the secondary circuit. The transformer

is   perfectly   efficient;   all   the   incoming   energy   is   transformed   from   the   primary   cir cuit   to   the magnetic   field   and   into   the   secondary   circuit.   If   this   condition   is   met,   the   incoming   electric power must equal the outgoing power.

Transformers   normally   have   high   efficiency   more   then   95%,   so   this   formula   is   a   reasonable approximation.   If the   voltage   is increased, then   the   current   is decreased   by   the same   factor. The

Impedance in one   circuit is transformed by the square of th e turn’s ratio.

Transformer E MF equation

If   the   flux   in   the   core   is   purely   sinusoidal,   the   relationship   for   either   winding   between   its   rms voltage   Erm of   the   winding , and the supply frequency   f, number of turns   N,   core   cross-sectional

area a and peak magnetic flux density B If   the   flux   does   not   contain   even   harmonics   the   following   equation   can   be   used   for   half-cycle

average voltage E

a  of any wave shape:

Transformer   ratios:     

The   voltage   ratio   of   a   constant-voltage   transformer,   i.e.,   the   ratio   of primary   to   secondary voltage,   depends   primarily   upon   the   ratio of   the   primary to   the   secondary turns.   The   voltage   ratio   will   vary   slightly   with   the   amount   and   power   factor   of   the   load.   For general work the voltage   ratio   can be taken as equal to the   turn ratio of the windings. The current

ratio   of   a   constant-voltage   transformer   will   be   approximately   equal   to   the   inverse   ratio   of   the turns in the two windings

The   regulation   of   a transformer     is   the change   in   secondary voltage from no   load   to   full load. It is generally expressed as a percentage of the full-load secondary voltage.

The   regulation   depends   upon   the   design   of    the   transformer   and   the   power   factor   of   the   lo ad. Although with a   non inductive   load   such as incandescent lamps, the regulation of transformers is

within about 3   percent,   with   an inductive load   the   drop in voltage between   no load and full load

increases   to   possibly   about   5   percent.   If   the   motor   load   is   large   and   fluctuating   and   close   lamp regulation is important, it is desirable to use separate transformers for the motors.

The   efficiency   of a   transformer     is, as   with   any   other   device, the   ratio of   the   output to   input or, in   other   words,   the   ratio   of   the   output   to   the   output   plus   the   losses.   As   a   formula   it   can   be expressed thus:

The copper loss  of a transformer is determined by the resistances of the high-tension and low-

tension   windings   and   of   the   leads.   It   is   equal   to   the   sum   of   the   watts   of   I   2R   losses   in   these components at the load for which it is desired to compute the efficiency.

The   iron   loss   of   a transformer   is   equal   to   the   sum   of   the   losses   in the   iron   core.   These   losses consist   of   eddy-   or   Foucault-current losses   and   hysteretic   losses. Eddy-current   losses   are due   to

currents generated   by the alternating   flux circulating   within   each lamination   composing the core,

and   they   are   minimized   by   using   thin   laminations   and   by   insulating   adjacent   laminations   with insulating   varnish.   Hysteretic   losses   are   due   to   the   power   required   to   reverse   the   magnetism   of the iron core at each   alternation and   are   determined by the amount and the grade of iron   used for

the laminations for the core.

Transformer ratings.  Transformers   are   rated   at   their   kilovolt-ampere   (kVA)  outputs. If   the load to be supplied   by a transformer is   at 100   percent power factor (pf), the kilowatt (kW) output

will   be   the   same   as the   kilovolt-ampere   (kVA) output.If   the load   has a lesser power facto r, the kW  output  will  be less  than   the  kVA  output  proportionally as the load power   factor   is   less than

100 percent.

Phase Transformer   Connection Construction:

A three phase transformer is constructed by winding three single phase transformers on a single core. These transformers are put into an enclosure which is then filled with dielectric oil. The dielectric oil performs several fun ctions. Since it is a dielectric,   a nonconductor of electricity, it provides electrical insulation between the windings and the case. It is also used to help provide cooling and to prevent the formation of moisture, which can d eteriorate the winding insulation.

There are only 4 possible transformer combinations: Delta to Delta – use: industrial applications

Delta to Wye – use : most common   for step-up   transformer; commercial and industrial

Wye to Delta – use :   most common for step-down   high voltage   Wye to Wye – use : rare, don’t use causes harmonics an d balancing problems.

Characteristics of Distribution Transformer:

1. According to method of cooling

a. Oil-immersed, combination self-cooled and fan -cooled

2. According to insulation between windings a. Windings insulated from each other

b. Autotransformers

3. According to number of phases a. Poly-phase

4. According to method of mounting a. Platform

5. According to purpose

a. Constant-voltage

b. Variable-voltage

6. According to service a. large power

b. Distribution

Bus-bar Arrangement

Bus-bars   are   the   important   components   in   a   substation   .there   are   several   bus-bar   arrangement that   can   be   used   in   substation   .The   choice   of   a   particular   arrangement   depends   upon   various factors such   as   voltage,   position   of   substation, degree   of reliability,   cost   etc.   These   are made   up of   copper   and   aluminum   to   which   the   terminal   of   generators,   transformers,   distribution   lines, loads   etc   is connected.   In an   electrical power distribution system that conduct   electricity within   a switchboard,   distribution   board,   substation,   or   other   electrical   apparatus.   These   bus-bar   are insulated from each other and also from the earth.

The   size   of   the   bulbar   is   important   in   determining   the   maximum   amount   of   current   that   can   be safely   carried.   Bus   bars   can    have   a   cross-sectional   area   o f   as   little   as   10 mm²   but   electrical substations may use metal tubes of 50 mm in diameter (1,963 mm²) or more as bus bars.

The following are the important bus-bar arrangements used in substation.

• Single busbar

• Single busbar system with sectionalisation

• Double/ Duplicate bus-bar arrangement

Duplicate type busbar

This   system   consists   of   two   bus-,a   main   bar-bar   and   a   spare   bus-bar.    Each   bus bar   has   the capacity to   take up the entire substation load .The   incoming and outgoing lines can   be connected

to   either   bus-bar   with   the   help   of   a   bus-bar   coupler   which   consists   of   a   circuit   breaker   and

Isolators.   The   incoming   and   outgoing   lines   remain   connected   to   the   main   bus bar.   However,   in case of   repair of   main bus-bar   or fault   occurring on   it,   the continuity of   supply to the circuit can

be maintained by transferring it to the spare bus-bar.

Insulators

The   insulator   serves   two   purpose.   They   support   the   conductor   (or   bus   bar   )   and   con fine   the current to the conductor.   The most commonly used material   for the manufactures of insulators is porcelain.   There are   several type of insulator (i.e. pine   type, suspension type etc.) and there used in Sub-Station will depend upon the service requirement.

Earth system :

Why ground?

Poor   grounding   not   only   contributes   to   unnecessary   downtime, but   a   lack   of   good   grounding   is also   dangerous   and   increases   the   risk   of   equipment   failure   .Without   an   effective   grounding system   ,we could be exposed   to   the   risk of   electric shock , not to   mention instrumentation errors ,harmonic   distortion issues, power   factor problems   and a host   of possible   intermittent dilemmas.

If fault currents have no path to the   ground   through   a   properly   designed   and   maintained   grounding   system,   they   will   find unintended   paths   that   could   include   people .The   following   organizations have   recommendations and/or standards for grounding to ensure safety:

• OSHA (Occupational Safety Health Administration)

• NFPA (National Fire Protection Association)

• ANSI/ISA (American National Standards Institute and   Instrument Society of America)

• TIA (Telecommunications Industry Association)

• IEC (International Electro-technical Commission)

• CENELEC (European Committee for Electro-technical Standardization)

• IEEE (Institute of Electrical and Electronics Engineers)

However,   good   grounding   isn’t   only   for   safety;   it   is   also   used   to   prevent   damage   to   industrial plants   and  equipment.   A   good   grounding   system   will   improve   the   reliability   of   equipment   and reduce   the   likelihood of   damage   due to lightning   or   fault   currents .Billions   are lost each   year   in

the workplace due   to electrical   fires. This does not account for   related   litigation costs and loss of personal and corporate productivity.

Why test grounding systems?

Over   time,   corrosive   soils   with   high   moisture   content,   high   salt   content,   and   high   temperatures can   degrade   ground   rods   and   their   connections.   So   although   the   ground   system   when   initially installed,   had   low   earth   ground   resistance   values,   the   resistance   of   the   grounding   system   can increase   if   the   ground   rods are eaten   away.   With frustrating,   intermittent electrical problems, the problem   could   be   related   to   poor   grounding   or   poor   power   quality   .That   is   why   it   is   highly recommended that   all grounds   and   ground   connections are checked   at least   annually   as   a   part of

your   normal   Predictive   Maintenance   plan.   During   these   periodic   checks,   if   an    increase   in resistance   of   more   than   20   %   is   measured,   the   technician   should   investigate   the   source   of   the problem,   and make   the correction to lower the resistance, by   replacing   or   adding   ground rods   to

the ground system.

What is a ground and what does it do?

The NEC,   National   Electrical   Code,   Article   100   defines   a   ground   as:   “a conducting connection, whether intentional   or   accidental   between   an   electrical   circuit   or equipment   and   the   earth,   or   to some   conducting   body   that   serves   in   place   of   the   earth.”   When   talking   about   grounding,   it   is actually two   different subjects:   earth grounding   and   equipment   grounding. Earth   grounding is   an intentional   connection   from   a circuit conductor,   usually   the   neutral, to a   ground electrode   placed in   the   earth.   Equipment   grounding   ensures   that   operating   equipment   within   a   structure   is

properly   grounded.   These   two   grounding   systems   are   required   to   be   kept   separate   except   for   a connection   between    the   two   systems.   This   prevents   differences   in   voltage   potential   from   a

possible   flashover   from   lightning   strikes.   The   purpose   of   a   ground   besides   the   protection   of people,   plants   and   equipment   is   to   provide   a   safe   path   for   the   dissipation   of   fault   currents, lightning strikes, static discharges, EMI and RFI signals and interference.

What is a good ground resistance value?

There   is   a   good   deal   of   confusion   as   to   what   constitutes   a   good   ground   and   what   the   ground resistance value needs to be. Ideally a ground should be of zero ohms resistance .There is not one

Standard ground resistance   threshold that   is recognized   by   all agencies. However,    the NFPA   and IEEE   have   recommended   a   ground   resistance   value   of   5.0 ohms or   less.   The   NEC   has   stated   to “Make sure   that   system   impedance   to   ground   is   less   than   25   ohms   specified   in NEC   250.56.   In facilities   with   sensitive   equipment   it   should   be   5.0   ohms   or   less.”   The   Telecommunications industry   has   often   used   5.0   ohms   or   less   as   their   value   for   grounding   and   bonding   .The   goal   in ground   resistance   is   to   achieve   the   lowest   ground   resistance   value   possible   that   makes   sense economically and physically.

Components of a ground electrode

• Ground conductor

• Connection between the ground   conductor and the ground electrode

• Ground electrode

Locations of resistances

(a)The ground electrode and its connection

The resistance of the ground electrode and   its connection is  generally very   low. Ground rods are generally made of highly conductive/low resistance material such as steel or copper.

(b) The contact resistance of the surrounding earth to the electrode

The National Institute of   Standards   (a   governmental   agency   within   the US   Dept.   of Commerce)has   shown   this   resistance   to   be   almost   negligible   provided   that   the   ground   electrode   is   free   of paint, grease,   etc. and that the ground electrode is in firm contact with the earth.

(c) The resistance of the surrounding body of earthThe ground   electrode is   surrounded by   earth which conceptually   is made   up   of concentric   shells all   having   the   same   thickness.   Those   shells   closest   to   the   ground   electrode   have   the   smallest amount   of area   resulting   in the   greatest   degree of   resistance.   Each subsequent shell   incorporates

a greater area resulting   in   lower resistance.   This   fin ally   reaches   a   point   where   the   additional   shells   offer   little resistance   to   the   ground    surrounding   the   ground    electrode.   So   based   on   this   information,   we should focus on ways to reduce the ground resistance when installing grounding systems.

What affects the grounding resistance?

First, the NEC   code   (1987, 250-83-3) requires   a minimum ground   electrode length of   2.5 meters (8.0 feet)   to be in contact  with soil. But, there are four   variables that   affect the ground resistance of a ground system:

1. Length/depth of the ground electrode

2. Diameter of the ground electrode

3. Number of ground electrodes

4. Ground system design

Length/depth of the ground electrode

One   very   effective way   of   lowering   ground   resistance   is   to   drive   ground   electrodes   deeper.   Soil is not consistent in its resistivity and can be highly unpredictable. It is critical when installing the ground electrode, that it   is   below   the   frost line.   This   is done   so that the resistance to   ground will not   be   greatly   influenced   by   the   freezing   of   the   surrounding   soil.   Generally,   by   doubling   the length   of   the   ground   electrode   you   can   reduce   the resistance  level   by an addition   a   l0   %.   There are   occasions   where   it   is   physically impossible   to   drive   ground   rods   deeper—areas   that   are composed   of   rock,   granite,   etc.   In   these   instances,   alternative   methods   including   grounding cement are viable.

Diameter of the ground electrode

Increasing   the diameter   of   the   ground   electrode   has   very   little   effect   in   lowering   the   resistance. For   ex ample,   you   could   double   the   diameter   of   a   ground   electrode   and your   resistance   would only decrease by 10 %.

Number of ground electrodes

               Figure -: Each ground electrode has its own ‘sphere of influence’.

Another way to lower ground resistance is to use multiple ground electrod es.   In this design, more than one electrode is driven into the ground and   connected in parallel to   lower the resistance. For additional electrodes to be effective, the spacing of additional rods need to be at least equal to the depth   of   the   driven   rod.   Without   proper   spacing   of   the   ground   electro des,   their   spheres   of influence will intersect and   the   resistance will not be   lowered.   To   assist you in installing a   g that will   meet   your   specific   resistance   requirements,   you   can   use   the   table   of   ground   resistances, below.   Remember,   this   is   to   only   be   used   as   a   rule   of   thumb,   because   soil   is   in   layers   and   is rarely homogenous. The resistance values will vary greatly.

Ground system design

Simple grounding systems consist of a single ground electrode driven into the ground. The use of a   single   ground electrode   is the   most common   form   of   grounding   and can   be found   outside your home   or   place   of   business.   Complex  grounding   systems   consist   of   multiple   ground   rods, connected,   mesh   or   grid networks,   ground   plates, and   ground loops.   These systems   are   typically installed at power generating substations,   central   offices, and cell   tower sites. Complex networks dramatically   increase   the   amount   of    contact   with   the   surrounding   earth   and   lower   ground resistances.

Figure: –   Mesh network,   Ground plate.

How do I measure soil resistance?

To   test   soil   resistivity,   connect   the   ground   tester   as   shown   below.   As   you   can   see,   four   earth ground   stakes   are   positioned   in   the   soil   in   a   straight   line,   equidistant   from   one   another.   The distance   between   earth   ground   stakes   should be at   least three   times   greater than   the   stake depth. So   if   the   depth   of   each   ground   stake   is   one   foot   (.30meters),   make   sure   the   distance   between stakes   is greater than three   feet (.91   meters). The Fluke   1625   generates a known current   through the two   outer   ground stakes and   the   drop in voltage   potential is   measured between   the   two inner

Ground   stakes.   Using   Ohm’s   Law   (V=IR),   the   Fluke   tester   automatically   calculates   the   soil resistance.   Because   measurement   results   are   often   distorter   and   invalidated   by   underground pieces of metal, underground aquifers,   etc. additional measurements where the stake’s axis are turned 90   degrees is always recommended. By changing the depth and distance several times, a profile is produced that can determine a   suitable ground   resistance   system.   Soil   resistivity   measurements   are   often   corrupted   by   the   existence   of ground   currents   and   their   harmonics.   To   prevent   this   from   occurring,   the   Fluke   1625   uses   an Automatic   Frequency   Control   (AFC)   System.   This   automatically   selects   the   testing   frequency with the least amount of noise enabling you to get a clear reading.

What are the Methods of Earth Ground Testing?

Fall-of-Potential measurement

The Fall-of-Potential test   method is used   to   measure the   ability   of   an   earth ground   system   or   an individual electrode to dissipate energy from a site.

How does the Fall-of-Potential test work?

First, the earth electrode of interest must be disconnected from its connection to the site. Second,   the tester   is   connected   to   the earth   electrode.   Then,   for   the   3-pole Fall-of-Potential test, two earth   stakes are placed in the soil   in a direct   line—away   from the earth   electrode. Normally,

spacing   of   20   meters   (65   feet)   is   sufficient.   For   more   detail   on   placing   the   stakes,   seethe   next section. A known current is   generated by the Fluk e 1625 between the outer stake (auxiliary earth stake) and the   earth   electrode, while the drop in

Voltage potential is measured between thee earth stake and the earth electrode. Using Ohm’s   Law

(V = IR ),   the   tester   automatically   calculates   the   resistance   of   the   earth   electrode.   Connect   the ground tester   as shown   in   the   picture. Press START and read out   the   RE   (resistance) value.   This is   the   actual   value   of   the   ground   electrode   under   test.   If   this   ground   electrode   is   in   parallel   or series with other ground rods, the RE value is the total value of all resistances.

How do you place the stakes?

To   achieve   the   highest   degree of accuracy when   performing a   3–pole ground resistance   test, it is essential   that   the   probe   is   placed   outside   the   sphere   of   influence   of   the   ground   electrode   under test and the   auxiliary   earth.   If   you   do not   get   outside the sphere of   influence, the   effective areas

of   resistance   will   overlap   and   invalidate   an y  measurements   that   you   are   taking.   The   table   is   a guide for   appropriately   setting the   probe   (inner   stake) and auxiliary   ground (outer   stake).To test the   accuracy   of   the   results   and   to   ensure   that   the   ground   stakes   are   outside   the   spheres   of influence,   reposition   the   inner   stake(probe)   1   meter   (3   feet)   in   either   direction   and   take   a   fresh measurement.   If   there   is   a   significant   change   in   the   reading   (30   %),   you    need   to   increase   the distance   between the ground rod   under test, the inner stake (probe)   and the outer stake (auxiliaryground)   until   the   measured   values   remain   fairly   constant  when  repositioning   the   inner   stake.

Specification

11/0.415kV, 7MVA   Sub-station of Instrument is …

a) 7MVA 33/11Kv Main Transformer,4 MVA.3 MVA.2 MVA.&1.5 MVA kVA Transformer 11kV/0.415kV

b) LT Switchgear-5000A 4000A 3000A

c) Dropout Fuse, Rated Voltage (Nominal) -11kV, Rated Current RMS -100A,1Set

d) Lightning Arrester , Rated Voltage (RMS) – 9kV, 1Set

e) 7Mva – 3 Units1500 KVAR-tow units,150KVAR 5-Units Automatic   PFI   Plant.

f) Current Transformer,   Ratio 2500/5A 1000/5A-500/5A,

g) Potential Transformer, Ratio -11//110V , 3pcs.

Setup Information

Factory   requirement   following   as   there   instrument   will   be   ascension.   There   Instrument   of   the figure      same   as   connection   from   the   distribution   line.   I   always   help   them   to connection and working time.

First   time   we are   connected   Isolator.   It   connect   to   main line   include   drop   out   Fuse   15A,   nos.   of

3pcs,   for   3   phase.   Isolator   one   terminals   connect   to   main   distribution   line   (11kv   line)   another terminals connect to current transformer   of primary side. This Isolator attach on the front of poll. After   transformer   connection.   Transformer   connected   is   delta   to   star,   primary   side   is   delta   and secondary   side   is   star.   primary   side   voltage   is   11kV   and   secondary   voltage   is   420V. Secondary side   of   common   terminal   connected   to   grounding   and   also   transformer   body   connected   to grounding.   Primary   side   bushing   number   is   3pcs.   and   secondary   side   bushing   number   is

4pcs.Transfomer   all   of   check,   oil   level,   silica   gel,   temperature,   and   all   nut   bolt.   Transformer secondary side connect to LT switch   gear (Low tension) its medium is LT cable.

Now   Low tension   switch   gear   connection. Low   tension indoor type switchgear   with   hard   drawn copper   bus-bars,   TPN&E   equipped   with   incoming      connected   is   1no.   500A,   36kA,   TP   MCCB with   adjustable   thermal   overload   and   adjustable   magnetic   short-circuit   releases.   3nos.   current transformer,   ratio:500/5A   with   suitable   accuracy   and   burden.   3nos.    Ammeter,   0-500A.

1no.Voltmeter, 0-500V   with selector switch. 2nos. indicating lamp   on/off    and 1 set control fuse.

Out   going   is   1no.   250A,36kA,TP   MCCB   with   adjustable   thermal   overload      and   adjustable magnetic   short   circuit   releases.   3nos.   100A,   16kA, TP   MCCB   with   adjustable thermal   overload and   adjustable   magnetic   short   circuit   releases.   2nos.   160A,   16kA,   TP   MCCB   with   adjustable thermal overload    and   adjustable magnetic short   circuit releases. Low   tension switch   gear   by the distributed   to   factory   machineries.   And   power   factor   improvement   plant   connected   from   low tension switchgear.

Sub-station   last   pert   is   150kVAR    automatic   power   factor   improvement   plant   connected.   It   is flour mounting, 415V, 50HZ, 150kVAR indoor type Automatic   power factor improvement plant,

comprising: 1no. 12.5kVAR bank of TP dry type power capacitor with built-in   discharge   resistor

(Direct). 1no. 12.5kVAR bank of  TP dry  type  power  capacitor   with   built-in  discharge  resistor.

3nos. 25kVAR  bank  of  TP  dry  type  power  capacitor with   built-in  discharge  resistor.   1no.

50kVAR   bank   of   TP   dry   type   power   capacitor   with   built-in   discharge   resistor.1no.   automatic power   factor   correction   relay.   5   nos.   TP   air   contractors   of   adequate   rating.   18   nos.   HRC   fuses with base of adequate rating. 5 nos. indicating lamps and 1 set control fuses. And   other   give  the  connected  on  Distribution   Box,   Switching   bo ard  etc.  There  are  connected from  low  tension   switchgear.  Distribution   Box  to  connect   the  Machineries   line.   And   all Instrument & machineries of   body connected to earth grounding.

Operation of Sub-station:

At   many   places   in   the   line   of   the   power   system,    it   may   be   desirable   and    necessary   to   change some   characteristic   (v oltage,   frequency,   power   factor   etc.)   of   electric   supply.   this   is

accomplished   by   suitable   apparatus   called   sub-station.   The   sub-station   operation   explained   as under:

1)   The   3-phase,   3-wire   11kV   line   is   tapped   and   brought   to   th e   gang   operating   switch installed      near   the   sub-station.   The   G.O.   switch   consists   of   isolators   connected   in    each phase of the 3-phase line.

2)   From   the   G.O.   switch,   the   11kV   line   is brought   to   the indoor   sub-station as   underground cable.   It is   fed to the H.T.   side of   the   transformer (11kV/400V) via the 11kV O.C.B. The transformer steps down the voltage to 400V, 3- phase, 4 wire.

3)   The secondary   of transformer   supplies to the bus-bars   via   the   main O.C.B. From the bus- bars,400V,   3   phase,   4-wire   supply   is   given   to   the   various   consumers   via   400V   O.C.B. The voltage between any phase and neutral it is 230V. The single phase residential load is

connected   between   any   one   phase   and   neutral   whereas   3-phase,   400V   motor   load   is connected   across 3 -phase lines directly.

4)   The   CTs   are   located   at   suitable   place   in   the   sub-station   circuit   and   supply   for   the metering   and indicating instruments and relay circuits.

Maintenance and Trouble shutting

1   Symmetrical Fault   The   symmetrical fault   rarely  The   symmetrical   fault   is   the occurs   in   practice   as  most severe   and imposes more majority   of   the   fault   are   of    heavy   duty   on   the   circuit unsymmetrical nature breaker.

The   reader  to understand the problems   that   short   circuit conditions   present   to   the power system.

2   Single  line to ground Any line with short to the Separate to   the   line from short fault.ground fault.circuit to solve the problem.

Insulation problem.

3   Line to line fault.   One line with another line toSeparate to   the   line from short short.circuit   for   solving the problem.Insulation problem.

4   Double   line   to   ground   Two   line   with   short   to   the     Separate to   the   line from short fault.

Insulation problem.

problem.

5   Arc phenomenon   When   a   short-short   circuit Arc   resistance   is   made   to occurs,  a   heavy   current   increase   with   time   so   that flows   the   contacts  of   the current   is   reduced   to   a   value circuit breaker. Insufficient   to   maintain   the arc.

The   ionized   particles   between the   contacts   tend   to   maintain the arc.

6   Transformer open circuit  An open circuit in one phase Open   phase   connect   with   to fault. of   a   3-phase   transformer             circuit may   cause   undesirable heating.

Relay protection is not provided against open circuits

On   the   occurrence   of such  a  because   this   condition   is fault, the transformer   can be  relatively harmless. disconnected   manually from the system.

7   Transformer  overheating Over heating   of  The relay   protection   is   also fault.transformer   is   usually  not   provide against   this caused   by   sustained contingency   and   thermal overloads   or   short-circuit accessories   are   generally   used and very   occasionally by the to   sound   an   alarm   or   control failure   of   the   cooling   the bank of fans.

system.

8   Transformer  Winding   short-circuit   (also  The   transformer   must   be short circuit fault.  called   internal   faults)   on   the     disconnected   quickly from the

transformer   arise   from system   because   a   prolonged deterioration  of   winding  arc   in   the   transformer   may insulation   due   to cause oil fire.

overheating   or   mechanical injury.

9   Lightning for   over   voltage   The   surges   due   to   internal        Surges   due   to   internal   causes fault. causes   hardly   increase   the          are   taken care   of   by   providing

system   voltage   to   twice   the      proper   insulation   to   the normal value.  equipment   in   the   power system.

A   lightning   arrester    is   a protective   device   which conducts   the   high   voltage surges on   the power   system   to the ground.

10   Low voltage   Supply voltage is low. Transformer   tap changing   turn to   move   after   solved   the problem.

SWITCHGEAR

The   term   switchgear,   used   in   association   with   the   electric   power   system,   or   grid,   refers   to   the electrical   equipments   like   isolators,   fuses,   circuit   breakers   which   intended   to   connect   and disconnect   power   circuits   are   known   collectively   as   switchgear.   Switchgear   is   used   in   connect with   generation,   transmission,   distribution   and   conversion   of   electric   power   for   controlling, metering   protecting   and   regulating   devices.   A   basic   function   of   switchgear   power   systems   is protection   of   short   circuits   and   overload   fault   currents   while   simultaneously   providing   service continuously   to   unaffected   circuits   while   avoiding   the   creation   of   an   electrical   hazard. Switchgear   power   systems   also   provide   important   isolation   of   various   circuits   from   different

power supplies   for safety   issues. There   are many different   types and   classifications of switchgear power systems to meet a variety of different needs.Switchgear power   systems   can   vary,   depending   on several   factors, such   as power   need, location of   system   and   necessary   security.   Therefore,   there   are   several   different   types   of   switchgear

power   systems   and   each   has   their   own   unique   characteristics   to   meet   the   specific   needs   of   the system and its location.

Switchgear   instruments of Factory

Factory   has   low   voltage   (up   to   380   volt)   and   medium   voltages   (up   to   400V)   switch   gear.   It   is indoor type and switch gear instruments are:

1)   Circuit   breaker   –     Miniature   circuit   breaker,   Vacuum   circuit   breaker,   molded   case   circuit breaker.

2)   Relay   –   Distance   Relay,   Over   current   and   Earth   fault   relay,   Under/Over   voltage   relay,   Trip circuit supervision relay, Differential protection relay, Static relay

3)   Current transformer (C T)

4)   Potential transformer (PT)

5)    Fuse

6)    Lightning   arrestor

7)   Isolator   and Earth switches

8)   Magnetic conductor

Current transformers (CT):

Current   Transformers   are   used   in   current   circuits   in   protection   systems   employing   secondary relays.    This   transformer   is   to   measure   large   currents   and   differs   in   phase   from   it   by   an   angle which   is   approximately   zero   for   an   appropriate   direction   of   the connections.   This   highlights the accuracy   requirement of   the current   transformer but also   important is   the   isolating   function. The

primary which is usually of few turns or even a single turn or thick copper or brass bar is inserted into   the   core   of   the   transformer   is   connected   in   series   with   the   load.    The   secondary   current   is normally   rated   for    5A   or    1A   and   the   number   of   turns   in   the   secondary   will   be   high.   When   the current transformer has   two   secondary   windings then one winding is   connected   to   the protective

relay   system   and   the   other   is   to   indicating   /   metering   circuit.   Current   transformer   windings   are polar in nature.    The current transformers   with   1A   rating   secondary   can   handle   25   times more burden   than   the   current   transformers   of   5A   secondary.    Current   Transformers   of 1ASecondaries   are normally used in the protection of 11 kV – 132 kV.

Transmission lines   where   the   substation apparatus   is   located   at   a   considerable distance from the control   room,   where   the   relays   are   situated.   The   magnitude   of   the   current   which   flows   through the secondary winding of   a   CT   is a function   of the   primary   current,   the   transformation ratio   and

also   the   impedance of   the secondary circuit.   CT’s   normally   operate under       Conditions   close   to short   circuit   conditions.    The   Secondar y   winding   burden   further   depends   upon   the   method   of connection   of   the   C T   secondary,   the   relay   windings   and   the   kind   of   short   circuit   experienced. CT’s used   for extra   high voltage net work protection must be   capable   of accurately   transmitting currents   both   during   steady   state   process   and   under   transient   conditions   in   order   to   permit operation   of   the   protective   devices   correctly.   The   reasons   for   choosing   proper   CT’s   for   extra high voltage net work protection are;

1. The time constants of DC components in the short circuit currents of EHV net works are large.

2.   The   ratio of   the short   circuit   current   to   the   rated   current   is   very   high, due to increased energy concentration.

3.   High   Speed   relaying   is   essential   to   protect   electrical   equipment   during   fault   and   to   increase system stability

The accuracy of a CT is directly   related to   a number of factors including:

Burden

Burden class/saturation class

Rating factor

Load

 External electromagnetic fields

Temperature and

Physical configuration.

The selected tap, for multi-ratio CT’s

 Ratio 5000/5A

Potential Transformers (PT):

Instrument   Transformers   are   of   means   of   extending   the   ran ge   of   AC   in str umen ts   like ammeters,    voltmeters,    V.A.R.   meters,   Walt-meters.   They   are   two   types   of   potential transformers.   The primary of   the   potential transformers is   connected   across the transmission line whose voltage   may   range   from 2.4   kV to   220 kV.   The   secondary   voltage is   standardized at 110 kV.   The load connected to the secondary is   referred to as   burden. The requirements of   the good potential transformers   are:

Accurate turns  ratio ,    n    =    V p/ Vs

The   difficulty   in   maintaining   the   accurate   turn’s   ratio   is   due   to   resistance   and   reactance   of   the windings and the value of the exciting current of the transformer.

Small   leakage   reactance.   The   leakage   reactance   is   due   to   the   leakage   of the   magnetic   fluxes   of the primary   and   secondary voltages.   They can   be   minimized   by   keeping the   primary, secondary windings   as   close   as   possible   subject   to   insulation   problem   as   the   primary   is   at   high   voltage.

Small   magnetic   current.   This   can   be   achieved   by   making   the   reluctance   of   the   core   as   small   as possible   and   flux   density   in   the   core   is   also   lowland   it   is   very   less   than   1   wb   /   m      Minimum Voltage   Drop:    The   resistance   of   the   windings   is   made   as   small   as   possible   The   Primary   as   it carries   high   voltage   should   be   heavily   insulated.    Hence   it   is   immersed   in   oil   and   the   terminals are brought out to   porcelain   bushing.   Now-a-days   synthetic rubber insulation like   styrene   is used avoiding   oil   and   porcelain.      When   the   load   or   burden   on   the   secondary   is   increased,   the secondary   current   increases   with   corresponding   increase   in   primary   current   so   that transformation ratio remains the same

Specification of Potential Transformer

• Manufacturer                                : ABB

• Device maximum operating voltage   : 35kV

• Rated frequency                                : 50-60Hz

• Rated voltage                                     : 11 kV

• Rated output                                       : 440V

Lightning Arrestor

A lightning arrester   is a   device used   on   electrical power   systems to   protect   the   insulation   on the system   from the damaging effect   of lightning. Metal   oxide   varistors (MOVs) have been   used for power system protection since the mid 1970s. The typical lightning arrester   also known as   surge

arrester has a   high   voltage   terminal   and   a   ground terminal.   When a lightning   surge   or switching surge travels down the   power system to the arrester, the current from the surge is diverted around

the protected insulation in most cases to earth.

Specification of Lightning Arrestor

• Manufacturer                                : ABB

• Rated voltage                                : 11kV

• Rated current                                 : 50-60Hz

• Rated discharging current              : 10kA

• Continuous operating voltage        : 100.8kV

• Residual voltage under thunder In : 10kA         615kV peak

• Standard discharging current                  : 1.0kAPeak

Isolators and earth switches :

Isolator   is   a   no-load   switch   designed   as   a   knife   switch   to   operate   under   no-load   conditions therefore   the   isolator   o pens   only   after   the   opening   after   the   circuit   breaker.   While   closing, isolator   closes   first   and   then   circuit   breaker.    Isolator   is   also   called   as   disconnecting   switch   or simply disconnected.    It is interlock with circuit breaker such that wrong operation is avoided. Its

main   purpose   is   to   isolate   one   portion   o f   the   circuit   from   the   other   and   is   not   intended   to   be

opened   while   current   is   flowing   in   the   line.   Such   switches   are   generally   used   on   both   sides   of circuit breakers in order that repairs and replacement of circuit breakers can be made without any

danger. During   the opening operation the   conducting   rods   swing apart   and   isolation   is   obtained.

The   simultaneous   operation   of   three   poles   is   obtained   by   mechanical   interlocking   of   the   three poles.   Further,   for   all   the   three   poles,   there   is   a   common   operating   mechanism.   The   operating mechanism is manual plus one of the following:

° Electrical motor mechanism

° Pneumatic  Mechanism.

They   should   never   be   opened   until   the   circuit   breaker   in   the   same   circuit   has   been   opened   and should   always   be   closed   before   the   circuit   breaker   is   closed.   .   MPS   has   3   pole   isolators   have three identical   poles. Each pole consists   of three insulator posts mounted on a fabricated support.

The   conducting   parts   are   supported   on   the   insulator   posts.   The   conducting   parts   consist   of conducting copper or aluminum rod, fixed and moving contacts. Isolators installed   in the outdoor

yard   can   be   operated   controlled   manually   or   electrically   on   electrical   mode   both   local   /   remote operations is   possible.    All   circuit   breakers can be operated /   controlled in   electrical   mode   either

local   /   remote   position.   The   remote   control   /   monitoring   of   all   isolators   and   circuit   breakers   is  done with the help of a set of control and metering panels Earth   Switch   is   connected   between   the   line   conductor   and   earth.    Normally   it   is   open   and   it   is closed   to   discharge   the   voltage   trapped   on   the   isolated   or disconnected   line.    When   the   line   is disconnected   from   the   supply   end,   there   is   some   voltage   on   the   line   to   which   the   capacitance between the line   and earth is charged.       This   voltage   is   significant   in    HV   systems .      Before commen cement   o f   maintenance   work   it is necessary that   these   voltages   are discharged to earth

by   closing   the   earth   switch.    Normally   the   earth   switches   are   mounted   on   the   frame   of   the isolator

Sequence of Operation while Opening/closing a circuit:

Opening Sequence:

1. Open Circuit Breaker

2. Open Isolator

3. Close Earth Switch

Closing Sequence:

1. Open Earth Switch

2. Close Isolator

3. Close Circuit Breaker

Circuit Breaker

A   circuit   breaker   is   an   automatically-operated   electrical switch   designed   to   protect   an   electrical circuit   from   damage   caused   by   overload   or   short   circuit.   Its   basic   function   is   to   detect   a   fault condition and these by interrupting continuity, to immediately discontinue electrical flow.

Principle of Operation

All   circuit breakers have   common features   in   their   operation,   although details vary substantially depending on   the   voltage class, current rating   and type of   the   circuit   breaker. The circuit breaker

must   detect   a   fault   condition   in   low-voltage   circuit   breakers   this   is   usually   done   within   the breaker   enclosure. Circuit breakers   for large   currents   or high voltages   are   usually   arranged   with pilot   devices   to   sense   a   fault   current   and   to   operate   the   trip   opening   mechanism.   The   trip

solenoid   that   releases   the   latch   is   usually   energized   b y   a   separate   battery,   although   some   high-

voltage   circuit   breakers   are   self-contained   with   current   transformers,   protection   relays   and   an internal control power source.

Once   a   fault   is   detected,   contacts   within   the   circuit   breaker   must   op en   to   interrupt   the   circuit. Some mechanically-stored energy (using   something   such as springs   or compressed air) contained

within the breaker is   used to separate   the   contacts,   although   some   of the energy required   may   be

obtained   from   the   fault   current   itself.   The   circuit   breaker   contacts   must   carry   the   load   current

without   excessive   heating,   and   must   also   withstand   the   heat   of    the   arc   produced   when interrupting   the   circuit.   Contacts   are   made   of   copper   or   copper   alloys,   silver   alloys   and    other materials.   Service   life   of   the   contacts   is   limited   b y   the   erosion   due   to   interrupting   the   arc. Miniature   circuit   breaker s   are   usually   discarded   when   the   contacts   are   worn,   but   power   circuit breakers and high-voltage circuit breakers have   replaceable contacts.

When   a   current   is   interrupted,   an   arc   is   generated   –   this   arc   must   be   contained,   cooled,   and extinguished   in   a   controlled   way,   so   that   the   gap   between   the   contacts   can   again   withstand   the voltage   in   the   circuit.   Different   circuit   breakers   use   vacuum,   air,   insulating   gas,   or   oil   as   the medium in which the arc forms.

Classification of   Circuit Breaker

According to the voltage level circuit breaker are classified into three categories, such as

1.   Low Voltage Circuit Breaker( Up to 619 volt)

2.   Medium Voltage Circuit Breaker(Up to 11kV)

3.   High Voltage Circuit Breaker(Up to 145kV )

Low Voltage Circuit Breaker

1.  Molded   Case   Circuit   Breaker   (MCCB):       Molded   case   circuit   breaker   operation   as   like   as thermal   or   thermal-magnetic   operation   and   rated   current   start   from100A.   Trip   current   may   be adjustable   in   larger   ratings.   The   molded   case   circuit   breaker (MCCB)   co mprises   the   following features:

• A contact system with arc-quenching   and current-limiting means

• A mechanism to open and close the contacts

• Auxiliaries   which   provide   additional   means   of   protection   and   indication   of   the   switch positions

Case Circuit Breaker

Figure  Molded Case Circuit Breaker

The   MCCB   may   be   used   as   an   incoming   device,   but   it   is   more   generally   used   as   an   outgoing device   on the load   side of   a   switchboard.   It   is normally   mounted into   a low-voltage switchboard

or   a   purpose-design ed   panel   board.   In   addition   to   the   three   features   listed   at   the   start   of   this section, it also includes:

• An   electronic   or   thermal/electromagnetic   trip   sensing   system   to   operate   through   the tripping mechanism and open the circuit breaker under overload or fault conditions

• All parts housed within a plastic molded housing made in two halves

• Current ratings usually from 10A to 1600A.

Miniature Circuit Breaker (MCB):        Miniature   circuit breakers   rated current not   more   than 100A. Trip characteristics   normally   not   adjustable.   The   miniature circuit   breaker   (MCB)   has   a   contact system and means   of arc   quenching, a mechanism and tripping   and protection system to open the

circuit   breaker   under   fault   conditions..   Early   devices   were   generally   of   the   ‘zero-cutting’   type, and   during a short circuit the current   had to pass through   a zero before the arc was extinguished;

this   provided   a   short-circuit   breaking   capacity   of   about   3kA.   Most   of   these   early   MCBs   were

housed   in   Bakelite   moldings.   The   modern   MC B   is   a   much   smaller   and   more   sophisticated device.   All   the   recent   developments   associated   with   molded   case   circuit   breakers   have   been incorporated   into MCBs   to   improve their   performance,   and   with breaking   capacities   of 10   kA   to

16   kA   now   available,   MCBs are used   in   all   areas   of   commerce and   industry   as   a   reliable means of protection. Most MCBs are of single-pole construction for use in single-phase circuits.

Miniature circuit Breaker

Figure – Miniature circuit Breaker

Medium Voltage Circuit Breakers

Medium-voltage   circuit   breakers   rated   between   619   Voltage   and   11   kV   assemble   into   metal- enclosed switchgear   line   ups   for indoor   use in MPS substation. Medium voltage circuit breakers

are   also   operated   by   current   sensing   protective   relays   operated   through   current   transformers. Medium-voltage   circuit   breakers   nearly   always   use   separate   current   sensors   and   protective relays, instead of   relying on built-in thermal or magnetic over current sensors.

Vacuum   circuit   breaker:        Vacuum   circuit   breaker   with   rated   current   up   to   3000   A,   these breakers   interrupts   the   current   by   creating   and   extinguishing   the   arc   in   a   vacuum   container. These are   generally   applied for voltages   up to about 35,000   V   but PS use vacuum circuit breaker

for   11KV   which   corresponds   roughly   to   the   medium-voltage   range   of   power   systems.   Vacuum circuit   breakers   tend   to   have   longer   life   expectancies   between   overhaul   than   do   air   circuit breakers.   Vacuum   circuit   breakers   tend   to   have   longer   life   expectancies   between   overhaul   th an do air circuit breakers.

In   a   vacuum   circuit   breaker,   two   electrical   contacts   are   enclosed   in   a   vacuum.   One   of   the contacts   is   fixed,   and   one   of   the   contacts   is   movable.   When   the   circuit   breaker   detects   a dangerous   situation,   the   movable   contact   pulls   away   from   the   fixed   contact,   interrupting   the current.   Because   the   contacts   are   in   a   vacuum,   arcing   between   the   contacts   is   suppressed,

ensuring   that   the   circuit   remains   open.   As   long   as   the   circuit   is   open,   it   will   not   be   energized.

Vacuum recluses will automatically reset   when   conditions   are   safe   again, closing the circuit   and

allowing   electricity   to   flow   through   it.   Re-closers   can    usually   go    through   several   cycles   before they will need to be manually reset

Vacuum   interrupters,   mounted   vertically   within   the   circuit   breaker   frame,   perform   the   circuit breaker   interruption.   Consisting   of   a   pair   of   butt   contacts,   one   movable   and   one   fixed, interrupters   require   only   a   short   contact   gap   for   circuit   interruption.   The   resulting   high-speed operation   allows   the entire operating sequence,   from fault   to   clear,   to   be   consistently   performed in three cycles or less.

The   primary   connection   to   the   associated   switchgear   is   through   the   six   primary   disconnects

mounted horizontally   at   the   rear of   the   circuit   breaker. Do not   subject the primary disconnects   to rough   treatment.   The operating   mechanism   is   of   the stored   energy   type.   It   uses charged   springs to   perform   breaker   opening   and   closing   functions.   The   operating   mechanism   contains   all necessary controls and   interlocks. It is mounted   at the front   of   the   circuit breaker for   easy access

during inspection and maintenance.

Specification of   Vacuum circuit breaker:

• Rated frequency-50 -60Hz

• Rated making Current-10 Peak kA

• Rated Voltage-11kV

• Supply Voltage Closing-220 V/DC

• Rated Current-1250 A

• Supply Voltage Tripping-220 V/DC

• Insulation Lev el-IMP 75 kVP

• Rated Short Time Current-40 kA (3 SEC)

High-voltage circuit breakers

Electrical   power   transmission   networks   are   protected   and   controlled   b y   high-voltage   breakers.

The   definition   of   high   voltage   varies   but   in   power   transmission   work   is   usually   thought   to   be

72.5 kV or higher. In MPS used SF6 circuit breaker for high voltage in sub station .High-voltage

breakers   are   always   solenoid-operated,   with   current   sensing   protective   relays   operated   through current   transformers.   In   substations   the   protective   relay   scheme   can   be   complex,   protecting equipment and busses from various types of overload or ground/earth fault.

FUSES:

A fuse is a   short piece   of wire or   thin strip which melts when excessive current flows             through   it for sufficient   time.   It   is   inserted   in   series   with   the   circuit   to   be   protected.   Under   normal   operating conditions   the   fuse   element   it   at   a   temperature   below   its   melting   point.   Therefore,   it   carries   the normal   load   current   without   overheating.   However   when   a   short   circuit   or   overload   occurs,   the current   through the fuse   element   increases   beyond its rated capacity. This raises the temperature and the   fuse   element   melts   (or   blows   out),   disconnecting   the   circuit   protected   by Init. electronics   and electrical   engineering   a   fuse   (short   for   fusible   link)   is   a   type   of   sacrificial   over   current   protection device. Its essential component is a metal wire or strip that melts when too much current flows, which

interrupts   the   circuit   in   which   it   is   connected.   Short   circuit,   overload   or   device   failure   is   often   the reason for excessive current.

Fuse Ratings:

Ampere Rating

Each   fuse   has   a   specific   ampere   rating,   which   is   its   continuous   current-carrying   capability. There are different types of fuse used in MPS, rating start from 2A.

Voltage Rating The voltage rating   of a f use   must   be   at least   equal   to   the   circuit voltage.   The voltage rating   of   a fuse can   be higher   than   the circuit voltage, but never lower. A 500   volt fuse,   for example, could be used in a 450 volt circuit, but a 350 volt fuse could not be used in a 500 volt circuit.

Magnetic Contactor

A magnetic contactor is a relay-controlled switch   used to turn a   power control circuit on and off.It   is   electrically   controlled and   uses   less   power   than   other   circuits.   A   magnetic   contactor   comes in different forms and capacities.Magnetic   contactors   are   a   form   of   electrical   relay   found   on   most   electrically   powered   motors. They   act   as   a   go-between   for   direct   power   sources,   and   high-load   electrical   motors   in   order   to homogenize   or   balance   out   changes   in   electrical   frequency   which   may   come   from   a   power supply as well as to act as a safeguard

Components

A magnetic contactor has three parts: power contacts,   contact   springs and auxiliary   contacts. The power contact creates, carries and breaks the current in   a magnetic contactor. The   contact springs create a sufficient amount   of   pressure   on the   contacts. Auxiliary contacts perform   signaling and interlocking   maneuvers.   Contactors   vary   in   size   and   capacity.   In   heavy   duty   magnetic Conductors,   blowout   coils   perform   magnetic   blowouts   so   the   current   can   go   further   with   more power.   Economizer   circuits   decrease   the   power   needed   to   keep   the   contactor   closed;   these   are usually found in direct-circuit contactor   coils working to keep the contactor cooler..

Input

A   basic   magnetic   conductor   has   a   coil   input   that   is   driven   by   either a   DC   or   AC   supply,   and   it can   be   energized   at   the   same   voltage   as   the   motor.   It   can   also   be   controlled   separately   using programmable   controllers   and   low   voltage   pilot   devices.   Most   contactors   handle   lighting,

Heating, electric motors and capacitor banks

Function of Magnetic conductor

Contactors   are   usually fitted on   open   contacts,   an d are   designed   to   suppress   and   control   electric arcs   which   are   produced   by   interrupting   heavy   motor   currents.   They   work   on   the   principle   of electromagnetism   and   the electricity   runs through   the   coil   from   the   core   of   the contactor.   While the core   is   moving,   a   force   is   developed   that   allows   the electromagnet   to   carry   charge   and   hold the   contacts   together.   Once   the   contactor   coil   is   de-energized,   the   spring   of   the   electromagnet returns to its original position.

Specification of Magnetic conductor:

Manufacturer   : Siemens

Model                     : LC1-D1210M7

Origin      : German

Coil Voltage   : 220V AC Voltage   : 415V

Frequency   : 50/60 Hz

Changeover

A   changeover   switch   for   a   tap   changer   including   a   pair   of   load   switches.   A   diverter   switch allows   load   to   be   diverted   along   a   second   path   when   its   associated   main   switch   is   opened   or closed. An   auxiliary circuit has an auxiliary switch and   a varistor connected in parallel across the

secondary   of   a   transformer.   When   the   auxiliary   switch   is   opened   the   varistor   impedance   is reflected   onto   the   primary   of   the   transformer   which   causes   the   current   in   the   main   switch   to divert   through   the   diverter   switch   so   that   the   main   switch   can   be   opened   or   closed   with substantially no load on it.

Manual Change over Switch

The Manual   change over   switch is wired into your Electrical Distribution   Board in your home or office   allowing   it   to   power   particular   appliances   in   your   home   or   office   by   providing   power   to specific circuits.

The manual change over switch can be used with the remote start button. The   Generator   does   however   need   time   to   get   up   to   speed   before   the   Manual   Change   Over Switch   can   be placed   on “Generator.” The recommended   time for   this is   5   Seconds. Hence when used in conjunction with   a remote start button, the generator should   be started   whilst   the   Manual Change over Switch is in the “Off” position. Once started and run   for the   recommended time the

switch   can   be moved to “Generator” providing power   to   the   relative circuits which   the   generator has been wired up to provide power to.The   Following   are   the   respective   Model   numbers   associated   with   the   Manual   change   over switches   and   their   capability   of single   or three   phase   power.   The   key   on   the   generator   has   to   be in   the ON position   for   the   manual   change   over   switch   to   work. The   manual   change   over   switch does not charge   the   battery so   should the key   be   left in the on   position   the   battery   will   go flat,   if

the generator is not used on a regular basis.

Protective Relaying and Protection

Protective   relays   are   used   to   detect   defective   lines   or   apparatus   and   to   initiate   the   operation   of circuit   interrupting   devices   to   isolate   the   defective   equipment.   Relays   are   also   used   to   detect abnormal   or   undesirable   operating   conditions   other   than   those   caused   by   defective   equipment and either operates   an alarm or initiate operation of circuit- interrupting dev ices A protection relay is   a   device that senses any change in the signal which it   is   receiving,   usually from a current and/or voltage   source.   If the magnitude   of   the incoming   signal   is outside   a   preset   range,   the relay will operate, generally to close or open electrical contacts to initiate some further operation,   for example the tripping of a circuit breaker.

Characteristic of relay:

Protection relays can be classified in accordance with the function which they carry out, their construction, the incoming signal and the type of functioning.

General function:

• Protection.

• Monitoring.

• Control .

Construction:

• Electromagnetic.

• Solid state.

• Microprocessor.

• Computerized.

• Incoming signal:

• Current.

• Voltage.

• Frequency.

Type of protection

• Over current.

• Directional   over   current.

• Distance.

• Over voltage.

• Differential.

• Reverse power.

over current and over voltage relay:

The   Over   current   and   over   voltage   relay   responds   to   a   magnitude   of   over   current   and   over voltage         above a   specified   value.   There   are   four   basic   types   of   construction:   They   are   plunger, rotating   disc,   static,   an d   microprocessor   type.   In   the   plunger   type,   a   plunger   is   moved   by magnetic   attraction   when   the   cur rent   exceeds   a   specified   value.   In   the   rotating   induction-disc

type, which   is a motor, the disc rotates   by electromagnetic induction when   the   current exceeds   a specified   value. Static types convert   the cur rent   to   a   proportional   D.C   mill   volt signal and apply it to a   level   detector   with   voltage or   contact   output. Such   relays   can   be   designed   to have   various current-versus-time   operating   characteristics.   In   a   special   type   o f   rotating   induction-disc   relay, called the voltage   restrained over current relay.

The   magnitude   of   voltage   restrains   the   operation   of   the   disc   until   the   magnitude   of   the   voltage drops   below   a   threshold   value.   Static   over   current   relays   are   equipped   with   multiple   curve characteristics   and   can   duplicate   almost   any   shape   of   electromechanical   relay   curve.

Microprocessor   relays   convert   the   current   and   voltage   to   a   digital   signal.    The   digital   signal   can then   be   compared   to   the   setting   values   input   into   the   relay.   With   the   microprocessor   relay, various curves or multiple time-delay settings can be input to set the relay operation. Some relays

allow   the   user   to   define   the   curve   with   points   or   calculations   to   determine   the   output characteristics.

 Distance Relay

The distance   relay   responds   to   a   combination   of   both   voltage   and   current.   The voltage restrains operation,   and   the   fault   current   causes   operation   that   has   the   overall   effect   of   measuring impedance.   The   relay   operates   instantaneously   (within   a   few   cycles)   on   a   60-cycle   basis   for values   of   impedance   below   the   set   value.   When   time   delay   is   required,   the   relays   energizes   a

separate   time-delay   relay   or   function   with   the   contacts   or   output   of   this   time-delay   relay   or function performing the   desired output functions. The   relay   operates   on   the   magnitude   of   impedance   measured   by   the   combination   of   restraint voltage and the   operating current passing through it according to   the settings applied to the relay.

When   the   impedance   is   such   that   the   impedance   point   is   within   the   impedance   characteristic circle,   the   relay   will   trip.   The   relay   is   inherently   directional.   The   line   impedance   typically corresponds   to   the   diameter   of   the   circle   with   the   reach   of   the   relay   being   the   diameter   of   the circle.

Differential Relay

The differential   relay is   a   current-operated   relay   that responds   to   the   difference   between   two   or more device   currents   above   a set value. The relay   works on   the   basis of   the   differential principle

That   what   goes   into   the   device   has   to   come   out   .If   the   current   does   not   add   to   zero,   the   error current   flows   to   cause   the   relay   to   operate   and   trip   the   circuit.   The   differential   relay   is   used   to provide   internal   fault   protection   to   equipment   such   as   transformers,   generators,   and   buses.

Relays are designed   to   permit   differences   in   the   input currents   as a result   of current   transformer mismatch and applications where   the input currents come from different   system voltages, such as transformers.   A current differential relay provides restraint coils   on the incoming current circuits.

The   restraint   coils   in   combination   with   the   operating   coil   provide   an   operation   curve,   above

which   the   relay   will   operate.   Differential   relays   are   often   used   with   a   lockout   relay   to   trip   all power   sources   to   the   device   and   prevent   the   device   from   being   automatically   or   remotely   re- energized.   These   relays   are   very   sensitive.   The   operation   of   the   device   usually   means   major problems with the protected equipment and the likely failure in re-energizing the equipment

Directional Over current Relay

A   directional   over   current   relay   operates   only   for   excessive   current   flow   in   a   given   direction. Directional   over   current   relays   are   available   in   electromechanical,   static,   and   microprocessor constructions. An electromechanical overcorrect relay is made directional b y adding a directional

unit   that   prevents   the   over   current   relay   from   operating   until   the   directional   unit   has   operated. The directional unit   responds to the   product   of   the   magnitude   of current,   voltage,   and   the   phase angle   between   them   or   to   the   product   of   two   currents   and   the   phase   angle   between   them.   The value of this product necessary   to provide operation   of the   directional unit is small,   so that   it will not   limit   the   sensitivity of the relay (such   as an   over current relay   that it controls). In most   cases, the directional   element   is mounted   inside the same case   as the relay   it controls. For   example,   an

over   current   relay and a   directional   element   are   mounted in the   same   case,   and   the   combination is   called   a   directional over current   relay.   Microprocessor   relays often   provide a choice as   to the polarizing method   that   can   be   used   in   providing   the direction   of fault,   such   as applying   residual current or voltage or negative sequence current or voltage polarizing functions to the relay.

Distribution board:

A distribution board      (or   panel) is a component of an        electricity   supply system which divides an electrical power   feed   into   subsidiary      circuits, while providing a   protective        fuse or   circuit breaker for   each   circuit,   in   a   common enclosure  . Normally, a main switch   , and   in   recent   boards, one   or   more  Residual-current   devices      (RCD)   or    Residual   Current   Breakers   with   Overecurrent protection   (RCBO), will also be

Maintenance Instruments of List

1 . Multi-meter (AVO)

2. Multi Screw Driver set

3. Pliers

4. Noose Pliers

5. Cutting Pliers

6. Hammer

7. Tester

8. Series Lamp

9. Wire Striper

10. Spanner set

11. Adjustable wrench

12. Clip-on meter

13. Soldering Iron

14. Griper Pliers

15. Punching etc.

CONCLUSION:

I   joint to  BSRM   Ltd. Factory   for   internship. This factory  of  all   worker   and management   is   very   good   and   helpfully. Their   help   for   my   internship   period happen be easy, therefore I would highly obliged. There, I learn to 11kv/.440kv Sub-station, Generator, Switchgear and  factory   maintenance   division  of equipments are working principle, competent and possible causes solution. Hare, many   new   machine, instruments  &  tools  about  understood.  There   are   many problem to face and their  with  try to  solution. This is   my   new experience. I am very enjoy  the internship  period,   because it   a new situation, new work and   new problem   solution   invention  and  new  learn  of   goods  are  characters.  I   hope   this experience will need of my service and my future.

substation

read more
EEEScience

Report on Electronic Media

 Introduction:

Television is a medium which attract a wide audience. It is an ideal tool for information, communication, education, entertainment and news etc. Television is like a window to see outer world. Through this window we can see what is happening around us. In Bangladesh there are many television channels. These televisions channels are working as strong electronic media in our country. These channels have created so much competitive field among them that continuously surfing those channels has become a habit for us. Thus a research was conducted through questionnaire survey to extract the information based on the perception of the audience about the electronic media in our country.

This report entitled ‘Urban Based Electronic Media Preferences Analysis’ is a fundamental requirement for the completion of the course Marketing Research (MKT-409). The main purpose of this report is to extract the information of the electronic media in the context of Bangladesh using specific research method. Under the instruction and guidance of the course instructor Mr. Shamsad Ahmed, we have taken the initiative to conduct the research and prepare this report with much precision and by being completely unbiased.

Electronic Media

The general objective of this report is to provide a synopsis of the electronic media of Bangladesh. It is also required for the completion of this course. Beside the general objective, the objectives behind this report are given below:

Primary objective:

The primary objective of the report is—

      To analyze on the issue ‘Urban Based Electronic Media Preferences Analysis’.

      To disclose the precise scenario of the electronic media through survey and SPSS software.

      To analyze and recommend on the mentioned issues.

Secondary objective:

The secondary objective to prepare this report is—

      To fulfill the requirements of our course Marketing Research.

      To have a clear understanding about the activity of specific research technique that is survey.

      To illustrate the position of Electronic Media based companies.

      To analyze the audiences demographic profile.

      To identify the audiences preference.

      To have a clear understanding about the SPSS software.

      To fulfill the requirements of our course “Marketing Research”.

      To gather experience and knowledge of doing a professional report.

This research study will cover the topic “Urban Based Electronic Media Preferences Analysis’” and its related issues. It also includes recommendations against the selected issues. This report can be used as a secondary source for the Electronic Media based companies.

To fulfill the objective of this report collection of relevant, accurate, standardized and needful information was required. To make this report reliable we have collected data from both primary sources and secondary sources. Special consideration was given so that chances of biasness could not arise. Special consideration was given so that chances of biasness could not arise. The sources used were:

Primary sources:

Primary data is defined as data which originates as a result of that particular investigation. We have collected primary data through questionnaire survey with various people. The primary data related to Electronic Media of Bangladesh was collected from the audiences by the method of survey that we conducted. Structured close ended questions were constructed to extract the primary data.

Secondary sources:

Secondary data represents the data which are made by others but it is useful for another purpose or research. As a part of collecting data from secondary sources, we have referred different books of Marketing Research. We collected our data from the magazine, news paper, libraries and also from the websites.

No study is beyond any limitations. While doing this research study we had to face some difficulties. The limitations of the research activities are as follows—

      We did not have so much experience for conducting research and preparing the report very frequently, though we are in learning position.

      In questionnaire survey some participants were unenthusiastic to provide enough information.

      The respondents hid their personal information.

      There was lack of precise information; both primary and secondary.

      There was not enough time to analyze the selected issues.

      Our resources (such as, human resource, financial resource, etc) were limited. So it was hard for us to prepare a professional report with our limited resources.

      First time ever we are using the SPSS software.

Research Design:

The design of the research that we carried to explore the opinion of the audiences of electronic media was conclusive to large extent. The research was formal and structured. It is based on large, representative sample, and the data obtained from the research will be used for Managerial decision making.

Sampling Design:

The size of the sample for the research was 500 respondents. The procedure adopted for sampling was Non Probabilistic Quota Sampling. The quota was formed based on occupations. The numbers of respondents was restricted by ten categories of occupations.

 Instruments:

The basic instruments used for the research were:

 SPSS software

      Structured Close Ended Questionnaire

      Computer

      MS Words

      Printer

Data Analysis Method:

For analyzing the data, we used SPSS software. The questionnaire consisted of ten close ended questions. The questions were basically formed with the purpose of providing descriptive information regarding the electronic media of Bangladesh. The data analyzed provided the information regarding the channel preference, program preference, factor preference, ranking of the channels, favorable program, unfavorable program and demographic profile of the respondents.

The factors for influencing the audiences were analyzed by factor reductions. This was done to separate the factors in two groups based on similarities in meaning.

The demographic profile of the respondents was used to formulate three clusters. The clusters were differentiated by the characteristics like gender, age, occupation, family members and family income.

Gender Distribution

Frequency

Percent

Valid Percent

Cumulative Percent

Valid 1

342

68.4

68.4

68.4

2

158

31.6

31.6

100.0

Total

500

100.0

100.0

We have surveyed total 500 respondents (audiences). 342 of them were male and rests of 158 were female. That is out of the total respondents who were surveyed, 68 per cent of them turned out to be male whereas the rest 32 per cent were female. This vast difference is due to the number of respondents that were kept under each occupation.

Initial Cluster Centers

Cluster

1

2

3

Gender

1

2

1

Age

6

4

3

Education

7

4

1

Occupation

7

1

5

Family member

4

3

1

Monthly family income

500000

3000000

1500

Iteration History (a):

Iteration

Change in Cluster Centers

1

2

3

1

.000

.000

28042.266

2

.000

.000

.000

a. Convergence achieved due to no or small change in cluster centers. The maximum absolute coordinate change for any center is .000. The current iteration is 2. The minimum distance between initial centers is 498500.000.

Final Cluster Centers:

Cluster

1

2

3

Gender

1

2

1

Age

6

4

5

Education

7

4

6

Occupation

7

1

5

Family member

4

3

3

Monthly family income

500000

3000000

29542

Number of Cases in each Cluster:

Cluster

1

1.000

2

1.000

3

459.000

Valid

461.000

Missing

39.000


Bangla Channel Viewer:

Frequency

Percent

Valid Percent

Cumulative Percent

Valid Viewer

478

95.6

95.6

95.6

Non viewer

22

4.4

4.4

100.0

Total

500

100.0

100.0

From the surveyed prople about 95.6% of the audiences watch Bangladesh TV channels and rests of the 4.4 % do not watch Bangladeshi TV Channels.

Statistics:

r1

r2

r3

r4

r5

r6

r7

r8

r9

r10

N Valid

429

438

452

458

451

383

412

400

367

414

Missing

71

62

48

42

49

117

88

100

133

86

Mean

5.12

7.12

3.32

2.62

2.78

6.80

5.81

5.62

7.61

5.73

Mode

5

10

1

2

1

8

5

7

10

7

BanglaVision is a new satellite TV channel that pledges to play a positive role in building the nation through healthy entertainment. It’s program lineup includes dramas, talk shows, feature films, entertainment programs etc and eight news bulletins in Bangla and one in English.

For the first time ever you can watch uninterrupted coverage of Asia’s leading international TV channels, over the Internet.

Jump TV proudly presents bangla language channels from Bangladesh. Enjoy an enticing palate of top quality programs ranging from news, entertainment, popular drama serials, musical programs, movies, documentaries, children’s programs to cultural programs and much more!

Amaar Ami

Bangla vision:

Frequency

Percent

Valid Percent

Cumulative Percent

Valid 1

25

5.0

5.8

5.8

2

43

8.6

10.0

15.9

3

56

11.2

13.1

28.9

4

62

12.4

14.5

43.4

5

65

13.0

15.2

58.5

6

54

10.8

12.6

71.1

7

33

6.6

7.7

78.8

8

44

8.8

10.3

89.0

9

34

6.8

7.9

97.0

10

13

2.6

3.0

100.0

Total

429

85.8

100.0

Missing System

71

14.2

Total

500

100.0

One of the main types of broadcast media in Bangladesh is TV, namely: “Bangladesh Television”. Bangladesh Television is the only terrestrial channel in the country. Several satellite TV stations have also made headway in Bangladesh.

Bangladesh Television is a government owned TV station. Very few broadcasts contain information about the political opposition until the general elections become nearer and the government in power takes control.

BTV:

Frequency

Percent

Valid Percent

Cumulative Percent

Valid 1

31

6.2

7.1

7.1

2

24

4.8

5.5

12.6

3

14

2.8

3.2

15.8

4

36

7.2

8.2

24.0

5

31

6.2

7.1

31.1

6

26

5.2

5.9

37.0

7

29

5.8

6.6

43.6

8

33

6.6

7.5

51.1

9

64

12.8

14.6

65.8

10

150

30.0

34.2

100.0

Total

438

87.6

100.0

Missing System

62

12.4

Total

500

100.0

ATN Bangla is the first Bengali digital cabletelevision channel. It transmits from its studio in Dhaka, Bangladesh. The channel is transmitted in South Asia, the Middle-east, Europe, and North America. The channel offers a wide variety of programming including news, movies, dramas, talk shows, and more.

ATN:

Frequency

Percent

Valid Percent

Cumulative Percent

Valid 1

98

19.6

21.7

21.7

2

93

18.6

20.6

42.3

3

88

17.6

19.5

61.7

4

62

12.4

13.7

75.4

5

42

8.4

9.3

84.7

6

30

6.0

6.6

91.4

7

17

3.4

3.8

95.1

8

8

1.6

1.8

96.9

9

9

1.8

2.0

98.9

10

5

1.0

1.1

100.0

Total

452

90.4

100.0

Missing System

48

9.6

Total

500

100.0

Channel-i, a Bangla-language channel, offers entertainment for the whole family and was the first digital Bangla channel in Bangladesh. Channel-i, one of the most highly rated Bangla channels, has become very popular among views for its wide range of programming including dramas, mega serials, musical programs, live interactive talk shows, magazine programs, agricultural programs and informative news bulletins broadcast 4 times a day.

Channel i

Frequency

Percent

Valid Percent

Cumulative Percent

Valid 1

126

25.2

27.5

27.5

2

140

28.0

30.6

58.1

3

98

19.6

21.4

79.5

4

48

9.6

10.5

90.0

5

16

3.2

3.5

93.4

6

10

2.0

2.2

95.6

7

6

1.2

1.3

96.9

8

4

.8

.9

97.8

9

7

1.4

1.5

99.3

10

3

.6

.7

100.0

Total

458

91.6

100.0

Missing System

42

8.4

Total

500

100.0

NTV is a Bengali language satellite television channel based in Bangladesh. It started operation in 2003. It was founded by Mosaddeq Ali Falu, a politician and former Member of Parliament from the ruling Bangladesh Nationalist Party. It is one of the most popular Bengali TV channels in the country. In the anniversary of the channel, the founder expressed interest in creating NTV2 to satisfy the watchers further, but however it is a matter of fun now that he is in jail and, all of his properties have been seized by the government. The channel broadcasts excellent coverage of news, soap shows, educational, religious and politics related programs.

NTV:

Frequency

Percent

Valid Percent

Cumulative Percent

Valid 1

143

28.6

31.7

31.7

2

105

21.0

23.3

55.0

3

82

16.4

18.2

73.2

4

60

12.0

13.3

86.5

5

22

4.4

4.9

91.4

6

16

3.2

3.5

94.9

7

3

.6

.7

95.6

8

9

1.8

2.0

97.6

9

4

.8

.9

98.4

10

6

1.2

1.3

99.8

21

1

.2

.2

100.0

Total

451

90.2

100.0

Missing System

49

9.8

Total

500

100.0

Boishakhi Media Lid. is a private sector effort, dedicated to the creative presentation of television technology for Bangla speaking people all over the world. The company has established round-the clock satellite television channel aimed at the a worldwide audience with programming depicting Bangla culture, history, geography, people, language, and faiths responding to both national and international needs and demands. The name of the channel is “BOISHAKHI”.

Boishakhi has a very experienced team of programmed makers, technical and management consultants with intimate knowledge and experienced of running a television station. Boishakhi has its own digital facilities with a large scale studio, a dedicated news studio, news room with its own independent news

gathering facilities, computerized editing facility and in house transmission/broadcast facility based in

Dhaka, Bangladesh.

Boishakhi will maintain a high-level of quality, technical efficiency and reliability while keeping up to date with state of the art technology. Given the need for a widely accessible platform Boishakhi intends to broadcast Globally, reaching out to a language group that is the world’s”4th most widely spoken” as declared by the United Nations.

It can be safely said that “Boishakhi” as a global and Bangla speaking channel will be available to 210 Million Bangalis worldwide.

Boishakhi:

Frequency

Percent

Valid Percent

Cumulative Percent

Valid 1

5

1.0

1.3

1.3

2

7

1.4

1.8

3.1

3

15

3.0

3.9

7.0

4

25

5.0

6.5

13.6

5

48

9.6

12.5

26.1

6

62

12.4

16.2

42.3

7

64

12.8

16.7

59.0

8

66

13.2

17.2

76.2

9

57

11.4

14.9

91.1

10

34

6.8

8.9

100.0

Total

383

76.6

100.0

Missing System

117

23.4

Total

500

100.0

RTV is a satellite television channel broadcast from Bangladesh. It started operation on 26 December2005.[1] It mainly broadcasts programmed in Bengali language.

RTV:

Frequency

Percent

Valid Percent

Cumulative Percent

Valid 1

14

2.8

3.4

3.4

2

16

3.2

3.9

7.3

3

27

5.4

6.6

13.8

4

40

8.0

9.7

23.5

5

85

17.0

20.6

44.2

6

77

15.4

18.7

62.9

7

64

12.8

15.5

78.4

8

45

9.0

10.9

89.3

9

29

5.8

7.0

96.4

10

15

3.0

3.6

100.0

Total

412

82.4

100.0

Missing System

88

17.6

Total

500

100.0

Ekushey Television (ETV) was the first private terrestrial channel in Bangladesh. Official transmission began on April 14, 2000, after a very short time of transmission it became the voice of the nation and the most popular TV channel in Bangladesh through its news and other innovative programs. However, it was closed down on August 29, 2002, when Managing Director Simon Dring and three other executives were charged with fraud. Dring, a British journalist, had his visa and work permit cancelled.

However, permission for the station to continue transmission once more was granted on April 14, 2005, and transmission was resumed, on December 1, 2006. Its official transmission started 29 March 2007 and, started 24 hour transmission on June 1.

ETV

Frequency

Percent

Valid Percent

Cumulative Percent

Valid 0

1

.2

.3

.3

1

20

4.0

5.0

5.3

2

19

3.8

4.8

10.0

3

38

7.6

9.5

19.5

4

54

10.8

13.5

33.0

5

56

11.2

14.0

47.0

6

57

11.4

14.3

61.3

7

63

12.6

15.8

77.0

8

48

9.6

12.0

89.0

9

28

5.6

7.0

96.0

10

16

3.2

4.0

100.0

Total

400

80.0

100.0

Missing System

100

20.0

Total

500

100.0

Islamic TV

Frequency

Percent

Valid Percent

Cumulative Percent

Valid 0

2

.4

.5

.5

1

6

1.2

1.6

2.2

2

8

1.6

2.2

4.4

3

10

2.0

2.7

7.1

4

19

3.8

5.2

12.3

5

25

5.0

6.8

19.1

6

30

6.0

8.2

27.2

7

39

7.8

10.6

37.9

8

58

11.6

15.8

53.7

9

78

15.6

21.3

74.9

10

92

18.4

25.1

100.0

Total

367

73.4

100.0

Missing System

133

26.6

Total

500

100.0

Channel One is a Bengali language satellite television channel from Bangladesh. It started broadcasting from Dhaka on 24 January2006. [1]

It is owned by the Masud Entertainment Limited, a sister concern of One Group.

This third generation television channel is the 8th private television in Bangladesh. This is an infotainment channel by nature. Its office is in Gulshan of Dhaka city. News times are 8 am, 12 pm, 2.30 pm, 6.30 pm, 7.30 pm, 10.00 pm, 12.30 am and 3.00 am in Bangladesh Time.

The channel’s journalists include Saiful Hasan, Saiful A Chowdhury, Shujon Mehedi, Shamim Al Amin and K U Biplob. Its producers include AKM Nazim, MAK Tuhin, Rana Islam and Iqbal Khokon. It uses final cut pro machines for video editing, and is the only channel that uses ENPS for news networking.

Channel One

Frequency

Percent

Valid Percent

Cumulative Percent

Valid 0

1

.2

.2

.2

1

13

2.6

3.1

3.4

2

20

4.0

4.8

8.2

3

45

9.0

10.9

19.1

4

56

11.2

13.5

32.6

5

60

12.0

14.5

47.1

6

49

9.8

11.8

58.9

7

63

12.6

15.2

74.2

8

49

9.8

11.8

86.0

9

45

9.0

10.9

96.9

10

13

2.6

3.1

100.0

Total

414

82.8

100.0

Missing System

86

17.2

Total

500

100.0

Correlation Matrix


fa1

fa2

fa3

fa4

fa5

fa6

fa7

fa8

fa9

fa10

fa11

Correlation fa1

1.000

.178

.000

.026

-.018

.064

.153

.158

.187

.015

-.048

  fa2

.178

1.000

-.002

.101

.037

.036

.103

.084

.125

.082

.004

  fa3

.000

-.002

1.000

-.097

.664

.751

-.071

-.079

-.102

-.123

.019

  fa4

.026

.101

-.097

1.000

-.088

-.098

.150

.180

.183

.056

-.052

  fa5

-.018

.037

.664

-.088

1.000

.687

-.012

-.060

-.055

-.068

.017

  fa6

.064

.036

.751

-.098

.687

1.000

-.062

-.107

-.092

-.111

.048

  fa7

.153

.103

-.071

.150

-.012

-.062

1.000

.166

.314

.194

-.025

  fa8

.158

.084

-.079

.180

-.060

-.107

.166

1.000

.300

.226

.053

  fa9

.187

.125

-.102

.183

-.055

-.092

.314

.300

1.000

.182

-.046

  fa10

.015

.082

-.123

.056

-.068

-.111

.194

.226

.182

1.000

.162

  fa11

-.048

.004

.019

-.052

.017

.048

-.025

.053

-.046

.162

1.000

The positive value that the two variables have a correlation. The maximum value that can be extracted is 1 which states the strongest relation among the variables.

KMO and Bartlett’s Test:

Kaiser-Meyer-Olkin Measure of Sampling Adequacy. .715
Bartlett’s Test of Sphericity Approx. Chi-Square 971.211
df 55
Sig. .000

The suitability of data for factor analysis depends on two measures: KMO index and Bartlett’s test. To be a suitable data, a data need to have a KMO index with minimum value of 0.6 and the Bartlett’s test for sphericity should be less than less than .05.

The data out here have KMO index value of .715 which is less than 0.6 but close enough to 0.6, and the Bartlett’s test for sphericity value is .000 which is less than.05.

Therefore, we can go for the Factor extraction.

Communalities

Initial

Extraction

fa1

1.000

.701

fa2

1.000

.812

fa3

1.000

.811

fa4

1.000

.827

fa5

1.000

.768

fa6

1.000

.830

fa7

1.000

.476

fa8

1.000

.422

fa9

1.000

.560

fa10

1.000

.569

fa11

1.000

.708

Extraction Method: Principal Component Analysis.

Total Variance Explained

Component Initial Eigenvalues Extraction Sums of Squared Loadings
Total % of Variance Cumulative % Total % of Variance Cumulative %
1 2.544 23.130 23.130 2.544 23.130 23.130
2 1.846 16.777 39.907 1.846 16.777 39.907
3 1.175 10.686 50.593 1.175 10.686 50.593
4 .998 9.072 59.666 .998 9.072 59.666
5 .920 8.368 68.033 .920 8.368 68.033
6 .851 7.733 75.766
7 .774 7.037 82.802
8 .686 6.238 89.040
9 .623 5.664 94.704
10 .342 3.105 97.809
11 .241 2.191 100.000

Extraction Method: Principal Component Analysis.

By the Kaiser’s criterion, the factors with eigenvalue equal to or greater to 1 are retained for further investigation. The eigenvalue of a factor represents the amount of the variance explained by that factor.

Out here, there are four components with eigenvalue greater to 1.

Therefore, these values will be taken for further analysis.

As we know that Kaiser’s criterion results in the retention of too many factors, therefore we need to go through Scree test. By the Scree test the factors above the elbow, or break in the plot, as the factors are considered to be the factors that contribute the most to the explanation of the variance in the set.

In this case, there are two factors that are above the elbow.

Component Matrix (a)

Component

1

2

3

4

5

fa1

-.088

.449

-.343

.556

-.253

fa2

-.066

.406

-.164

.548

.562

fa3

.851

.278

.018

-.098

.000

fa4

-.271

.323

-.190

-.480

.619

fa5

.801

.332

.047

-.116

.000

fa6

.856

.312

.015

-.015

.007

fa7

-.258

.550

-.043

-.168

-.278

fa8

-.312

.529

.171

-.121

-.034

fa9

-.332

.609

-.094

-.161

-.208

fa10

-.293

.367

.586

-.006

-.070

fa11

.030

.041

.780

.256

.177

Extraction Method: Principal Component Analysis. a 5 components

News

Frequency

Percent

Valid Percent

Cumulative Percent

Valid 1

226

45.2

52.4

52.4

2

42

8.4

9.7

62.2

3

25

5.0

5.8

68.0

4

21

4.2

4.9

72.9

5

19

3.8

4.4

77.3

6

5

1.0

1.2

78.4

7

13

2.6

3.0

81.4

8

15

3.0

3.5

84.9

9

11

2.2

2.6

87.5

10

7

1.4

1.6

89.1

11

8

1.6

1.9

91.0

12

4

.8

.9

91.9

13

5

1.0

1.2

93.0

14

4

.8

.9

94.0

15

2

.4

.5

94.4

16

3

.6

.7

95.1

17

3

.6

.7

95.8

18

4

.8

.9

96.8

19

1

.2

.2

97.0

20

2

.4

.5

97.4

21

4

.8

.9

98.4

23

2

.4

.5

98.8

24

1

.2

.2

99.1

25

1

.2

.2

99.3

27

3

.6

.7

100.0

Total

431

86.2

100.0

Missing System

69

13.8

Total

500

100.0

  Statistics:

Bangla Cinema:

Frequency

Percent

Valid Percent

Cumulative Percent

Valid 1

49

9.8

13.4

13.4

2

12

2.4

3.3

16.7

3

21

4.2

5.8

22.5

4

19

3.8

5.2

27.7

5

28

5.6

7.7

35.3

6

21

4.2

5.8

41.1

7

20

4.0

5.5

46.6

8

13

2.6

3.6

50.1

9

4

.8

1.1

51.2

10

15

3.0

4.1

55.3

11

9

1.8

2.5

57.8

12

11

2.2

3.0

60.8

13

5

1.0

1.4

62.2

14

8

1.6

2.2

64.4

15

7

1.4

1.9

66.3

16

15

3.0

4.1

70.4

17

11

2.2

3.0

73.4

18

7

1.4

1.9

75.3

19

6

1.2

1.6

77.0

20

12

2.4

3.3

80.3

21

12

2.4

3.3

83.6

22

7

1.4

1.9

85.5

23

5

1.0

1.4

86.8

24

9

1.8

2.5

89.3

25

8

1.6

2.2

91.5

26

11

2.2

3.0

94.5

27

20

4.0

5.5

100.0

Total

365

73.0

100.0

Missing System

135

27.0

Total

500

100.0

Drama

Frequency

Percent

Valid Percent

Cumulative Percent

Valid 1

67

13.4

15.6

15.6

2

99

19.8

23.1

38.7

3

80

16.0

18.6

57.3

4

43

8.6

10.0

67.4

5

35

7.0

8.2

75.5

6

17

3.4

4.0

79.5

7

15

3.0

3.5

83.0

8

10

2.0

2.3

85.3

9

9

1.8

2.1

87.4

10

10

2.0

2.3

89.7

11

7

1.4

1.6

91.4

12

8

1.6

1.9

93.2

13

6

1.2

1.4

94.6

14

4

.8

.9

95.6

15

4

.8

.9

96.5

16

5

1.0

1.2

97.7

18

2

.4

.5

98.1

19

1

.2

.2

98.4

20

2

.4

.5

98.8

22

1

.2

.2

99.1

23

2

.4

.5

99.5

25

1

.2

.2

99.8

27

1

.2

.2

100.0

Total

429

85.8

100.0

Missing System

71

14.2

Total

500

100.0

Drama Serial

Frequency

Percent

Valid Percent

Cumulative Percent

Valid 1

50

10.0

12.1

12.1

2

104

20.8

25.2

37.3

3

56

11.2

13.6

50.8

4

48

9.6

11.6

62.5

5

25

5.0

6.1

68.5

6

24

4.8

5.8

74.3

7

18

3.6

4.4

78.7

8

12

2.4

2.9

81.6

9

10

2.0

2.4

84.0

10

10

2.0

2.4

86.4

11

5

1.0

1.2

87.7

12

6

1.2

1.5

89.1

13

8

1.6

1.9

91.0

14

2

.4

.5

91.5

15

3

.6

.7

92.3

16

4

.8

1.0

93.2

17

6

1.2

1.5

94.7

18

1

.2

.2

94.9

19

5

1.0

1.2

96.1

21

3

.6

.7

96.9

22

3

.6

.7

97.6

23

3

.6

.7

98.3

25

3

.6

.7

99.0

26

3

.6

.7

99.8

27

1

.2

.2

100.0

Total

413

82.6

100.0

Missing System

87

17.4

Total

500

100.0

Entertainment Magazine Program:

Frequency

Percent

Valid Percent

Cumulative Percent

Valid 1

21

4.2

5.1

5.1

2

28

5.6

6.7

11.8

3

62

12.4

14.9

26.7

4

61

12.2

14.7

41.4

5

60

12.0

14.5

55.9

6

37

7.4

8.9

64.8

7

27

5.4

6.5

71.3

8

17

3.4

4.1

75.4

9

18

3.6

4.3

79.8

10

17

3.4

4.1

83.9

11

9

1.8

2.2

86.0

12

7

1.4

1.7

87.7

13

8

1.6

1.9

89.6

14

7

1.4

1.7

91.3

15

5

1.0

1.2

92.5

16

4

.8

1.0

93.5

17

5

1.0

1.2

94.7

18

3

.6

.7

95.4

19

2

.4

.5

95.9

20

3

.6

.7

96.6

21

3

.6

.7

97.3

23

3

.6

.7

98.1

24

1

.2

.2

98.3

25

4

.8

1.0

99.3

26

2

.4

.5

99.8

27

1

.2

.2

100.0

Total

415

83.0

100.0

Missing System

85

17.0

Total

500

100.0

News Related Magazine Program:

Frequency

Percent

Valid Percent

Cumulative Percent

Valid 1

4

.8

1.3

1.3

2

8

1.6

2.5

3.8

3

22

4.4

7.0

10.8

4

21

4.2

6.7

17.5

5

17

3.4

5.4

22.9

6

21

4.2

6.7

29.6

7

20

4.0

6.4

36.0

8

13

2.6

4.1

40.1

9

12

2.4

3.8

43.9

10

16

3.2

5.1

49.0

11

15

3.0

4.8

53.8

12

11

2.2

3.5

57.3

13

6

1.2

1.9

59.2

14

13

2.6

4.1

63.4

15

18

3.6

5.7

69.1

16

7

1.4

2.2

71.3

17

7

1.4

2.2

73.6

18

8

1.6

2.5

76.1

19

14

2.8

4.5

80.6

20

12

2.4

3.8

84.4

21

11

2.2

3.5

87.9

22

12

2.4

3.8

91.7

23

5

1.0

1.6

93.3

24

8

1.6

2.5

95.9

25

6

1.2

1.9

97.8

26

5

1.0

1.6

99.4

27

2

.4

.6

100.0

Total

314

62.8

100.0

Missing System

186

37.2

Total

500

100.0

Religious Program:

Frequency

Percent

Valid Percent

Cumulative Percent

Valid 1

7

1.4

2.2

2.2

2

26

5.2

8.0

10.2

3

27

5.4

8.3

18.5

4

23

4.6

7.1

25.6

5

17

3.4

5.2

30.9

6

22

4.4

6.8

37.7

7

10

2.0

3.1

40.7

8

8

1.6

2.5

43.2

9

13

2.6

4.0

47.2

10

11

2.2

3.4

50.6

11

10

2.0

3.1

53.7

12

14

2.8

4.3

58.0

13

6

1.2

1.9

59.9

14

5

1.0

1.5

61.4

15

6

1.2

1.9

63.3

16

10

2.0

3.1

66.4

17

10

2.0

3.1

69.4

18

16

3.2

4.9

74.4

19

12

2.4

3.7

78.1

20

13

2.6

4.0

82.1

21

6

1.2

1.9

84.0

22

8

1.6

2.5

86.4

23

6

1.2

1.9

88.3

24

8

1.6

2.5

90.7

25

6

1.2

1.9

92.6

26

8

1.6

2.5

95.1

27

16

3.2

4.9

100.0

Total

324

64.8

100.0

Missing System

176

35.2

Total

500

100.0

Cooking Program:

Frequency

Percent

Valid Percent

Cumulative Percent

Valid 1

6

1.2

1.9

1.9

2

6

1.2

1.9

3.7

3

9

1.8

2.8

6.5

4

9

1.8

2.8

9.3

5

25

5.0

7.7

17.0

6

17

3.4

5.2

22.2

7

12

2.4

3.7

25.9

8

12

2.4

3.7

29.6

9

14

2.8

4.3

34.0

10

7

1.4

2.2

36.1

11

7

1.4

2.2

38.3

12

10

2.0

3.1

41.4

13

12

2.4

3.7

45.1

14

8

1.6

2.5

47.5

15

10

2.0

3.1

50.6

16

6

1.2

1.9

52.5

17

12

2.4

3.7

56.2

18

9

1.8

2.8

59.0

19

10

2.0

3.1

62.0

20

20

4.0

6.2

68.2

21

13

2.6

4.0

72.2

22

15

3.0

4.6

76.9

23

16

3.2

4.9

81.8

24

9

1.8

2.8

84.6

25

9

1.8

2.8

87.3

26

18

3.6

5.6

92.9

27

23

4.6

7.1

100.0

Total

324

64.8

100.0

Missing System

176

35.2

Total

500

100.0


Talk Show

Frequency

Percent

Valid Percent

Cumulative Percent

Valid 1

2

.4

.6

.6

2

16

3.2

4.9

5.5

3

24

4.8

7.4

12.9

4

22

4.4

6.8

19.7

5

21

4.2

6.5

26.2

6

25

5.0

7.7

33.8

7

18

3.6

5.5

39.4

8

14

2.8

4.3

43.7

9

13

2.6

4.0

47.7

10

14

2.8

4.3

52.0

11

18

3.6

5.5

57.5

12

15

3.0

4.6

62.2

13

12

2.4

3.7

65.8

14

7

1.4

2.2

68.0

15

8

1.6

2.5

70.5

16

3

.6

.9

71.4

17

6

1.2

1.8

73.2

18

9

1.8

2.8

76.0

19

5

1.0

1.5

77.5

20

8

1.6

2.5

80.0

21

7

1.4

2.2

82.2

22

7

1.4

2.2

84.3

23

8

1.6

2.5

86.8

24

9

1.8

2.8

89.5

25

12

2.4

3.7

93.2

26

12

2.4

3.7

96.9

27

10

2.0

3.1

100.0

Total

325

65.0

100.0

Missing System

175

35.0

Total

500

100.0

Band Show Program:

Frequency

Percent

Valid Percent

Cumulative Percent

Valid 1

4

.8

1.2

1.2

2

9

1.8

2.7

4.0

3

7

1.4

2.1

6.1

4

11

2.2

3.4

9.5

5

15

3.0

4.6

14.0

6

24

4.8

7.3

21.3

7

12

2.4

3.7

25.0

8

16

3.2

4.9

29.9

9

16

3.2

4.9

34.8

10

8

1.6

2.4

37.2

11

14

2.8

4.3

41.5

12

13

2.6

4.0

45.4

13

17

3.4

5.2

50.6

14

10

2.0

3.0

53.7

15

14

2.8

4.3

57.9

16

9

1.8

2.7

60.7

17

14

2.8

4.3

64.9

18

11

2.2

3.4

68.3

19

14

2.8

4.3

72.6

20

4

.8

1.2

73.8

21

8

1.6

2.4

76.2

22

13

2.6

4.0

80.2

23

12

2.4

3.7

83.8

24

8

1.6

2.4

86.3

25

12

2.4

3.7

89.9

26

12

2.4

3.7

93.6

27

21

4.2

6.4

100.0

Total

328

65.6

100.0

Missing System

172

34.4

Total

500

100.0

Tele Film:

Frequency

Percent

Valid Percent

Cumulative Percent

Valid 1

12

2.4

3.1

3.1

2

7

1.4

1.8

4.9

3

23

4.6

5.9

10.8

4

30

6.0

7.7

18.5

5

22

4.4

5.6

24.1

6

39

7.8

10.0

34.1

7

28

5.6

7.2

41.3

8

28

5.6

7.2

48.5

9

25

5.0

6.4

54.9

10

19

3.8

4.9

59.7

11

19

3.8

4.9

64.6

12

16

3.2

4.1

68.7

13

16

3.2

4.1

72.8

14

15

3.0

3.8

76.7

15

17

3.4

4.4

81.0

16

14

2.8

3.6

84.6

17

8

1.6

2.1

86.7

18

6

1.2

1.5

88.2

19

12

2.4

3.1

91.3

20

2

.4

.5

91.8

21

7

1.4

1.8

93.6

22

3

.6

.8

94.4

23

3

.6

.8

95.1

24

9

1.8

2.3

97.4

25

1

.2

.3

97.7

26

4

.8

1.0

98.7

27

5

1.0

1.3

100.0

Total

390

78.0

100.0

Missing System

110

22.0

Total

500

100.0


Correlation Matrix


RON1

RON2

RON3

RON4

RON5

RON6

RON7

RON8

RON9

RON10

Correlation Bangla Vision

1.000

.177

.070

.140

.163

.133

.224

.044

.157

.307

BTV

.177

1.000

-.020

.047

-.116

.173

.181

.095

.290

.172

ATN

.070

-.020

1.000

.158

.137

.053

-.008

.164

.004

.000

Channel i

.140

.047

.158

1.000

.218

.040

.110

.179

.117

.190

NTV

.163

-.116

.137

.218

1.000

.045

.144

.038

.115

.190

Baishakhi

.133

.173

.053

.040

.045

1.000

.290

.131

.210

.241

RTV

.224

.181

-.008

.110

.144

.290

1.000

.205

.147

.292

ETV

.044

.095

.164

.179

.038

.131

.205

1.000

.080

.151

Islamic TV

.157

.290

.004

.117

.115

.210

.147

.080

1.000

.172

Channel One

.307

.172

.000

.190

.190

.241

.292

.151

.172

1.000

KMO and Bartlett’s Test


Kaiser-Meyer-Olkin Measure of Sampling Adequacy.

.693

Bartlett’s Test of Sphericity Approx. Chi-Square

329.400

df

45

Sig.

.000

Communalities:

Initial

Extraction

Bangla Vision (RON 1)

1.000

.477

BTV (RON 2)

1.000

.713

ATN (RON 3)

1.000

.716

Channel I (RON 4)

1.000

.628

NTV (RON 5)

1.000

.704

Baishakhi (RON 5)

1.000

.732

RTV (RON 6)

1.000

.601

ETV (RON 7)

1.000

.749

Islamic TV (RON 8)

1.000

.671

Channel One (RON 10)

1.000

.561

Extraction Method: Principal Component Analysis

Total Variance Explained:

Component

Initial Eigenvalues

Extraction Sums of Squared Loadings

Total

% of Variance

Cumulative %

Total

% of Variance

Cumulative %

1

2.297

22.974

22.974

2.297

22.974

22.974

2

1.336

13.355

36.329

1.336

13.355

36.329

3

1.076

10.758

47.087

1.076

10.758

47.087

4

.972

9.720

56.808

.972

9.720

56.808

5

.871

8.709

65.516

.871

8.709

65.516

6

.854

8.543

74.059

7

.722

7.223

81.283

8

.677

6.773

88.055

9

.630

6.300

94.355

10

.565

5.645

100.000

Extraction Method: Principal Component Analysis.                                

Component Matrix (a)

Component

1

2

3

4

5

ron1

.546

.011

-.368

.131

-.162

ron2

.436

-.536

.224

.398

-.164

ron3

.180

.548

.448

.213

.369

ron4

.419

.487

.062

.272

-.370

ron5

.356

.564

-.432

.016

.268

ron6

.525

-.259

.147

-.315

.519

ron7

.611

-.125

-.026

-.459

-.026

ron8

.397

.195

.640

-.252

-.283

ron9

.498

-.266

.005

.521

.284

ron10

.648

-.013

-.259

-.180

-.203

Extraction Method: Principal Component Analysis.

a 5 components extracted.

  • 7 – 9 am ……………………………….. (1)
  • 9 am – 1 pm ………………………….. (2)
  • 1 – 5 pm ……………………………….. (3)
  • 5 – 7 pm ……………………………….. (4)
  • 7 – 8.5 pm …………………………….. (5)
  • 8.5 – 10 pm …………………………… (6)
  • 10 – 12 pm ……………………………. (7)
  • After 12 am …………………………… (8)

Statistics:

N

Valid

482

Missing

18

Mode

6

Std. Deviation

1.151

Range

7

Preferable Time:

Frequency

Percent

Valid Percent

Cumulative Percent

Valid 1

2

.4

.4

.4

2

5

1.0

1.0

1.5

3

21

4.2

4.4

5.8

4

26

5.2

5.4

11.2

5

55

11.0

11.4

22.6

6

238

47.6

49.4

72.0

7

125

25.0

25.9

97.9

8

10

2.0

2.1

100.0

Total

482

96.4

100.0

Missing System

18

3.6

Total

500

100.0

Time of Watching Bangladeshi Channels:

Frequency

Percent

Valid Percent

Cumulative Percent

Valid

1

99

19.8

20.5

20.5

2

140

28.0

29.0

49.6

3

126

25.2

26.1

75.7

4

98

19.6

20.3

96.1

5

19

3.8

3.9

100.0

Total

482

96.4

100.0

Missing

System

18

3.6

Total

500

100.0

Foreign Movie (Action, science fiction, comedy etc)

      Sports Channel

      Talent Hunting Program

      Children Related Program

      Comedy Type Program

      Adventure Program

      Computer / Technological Program

      Cultural Program

      Award Show

      Science Related Program

      Animal Life Program

Statistics:

N Valid

500

Missing

0

Mode

4

Variance

1.627

Age:

Frequency

Percent

Valid Percent

Cumulative Percent

Valid 1

1

.2

.2

.2

2

9

1.8

1.8

2.0

3

46

9.2

9.2

11.2

4

240

48.0

48.0

59.2

5

96

19.2

19.2

78.4

6

53

10.6

10.6

89.0

7

38

7.6

7.6

96.6

8

17

3.4

3.4

100.0

Total

500

100.0

100.0

  • Illiterate ……………………………………………………… (1)
  • Literate ……………………………………………………. (2)
  • Secondary Level ……………(Bangali)………………….(3)
  • Ordinary Level …………………………………………… (4)
  • Higher Secondary Level ……..(Bangali)…………….. (5)
  • Advanced Level ………………………………………….. (6)
  • Under Graduate …………………………………………..(7)
  • Post Graduate ……………………………………………..(8)

Statistics

                                                Edu

N Valid

500

Missing

0

Std. Error of Mean

.099

Std. Deviation

2.216

Range

7

Minimum

1

Education:

Frequency

Percent

Valid Percent

Cumulative Percent

Valid

1

16

3.2

3.2

3.2

2

55

11.0

11.0

14.2

3

68

13.6

13.6

27.8

4

4

.8

.8

28.6

5

87

17.4

17.4

46.0

6

5

1.0

1.0

47.0

7

165

33.0

33.0

80.0

8

100

20.0

20.0

100.0

Total

500

100.0

100.0

      1 Person …………………………. (1)

      2 – 3 Person ………………………(2)

      4 – 5 Person ………………………(3)

      6 – 8 Person ………………………(4)

      8 + …………………………………. (5)

Statistics:

N Valid

498

Missing

2

Mode

3

Range

4

Percentiles 25

3.00

50

3.00

75

4.00

Family Member:

Frequency

Percent

Valid Percent

Cumulative Percent

Valid

1

3

.6

.6

.6

2

71

14.2

14.3

14.9

3

283

56.6

56.8

71.7

4

118

23.6

23.7

95.4

5

23

4.6

4.6

100.0

Total

498

99.6

100.0

Missing

System

2

.4

Total

500

100.0

CONCLUSION:

Television is playing a good role in our country. Though several television channels are operating in our country all of them are not providing same services. They have to count every nick of time in news presenting and other programs presenting. Analyzing the urban based electronic media preference the following result can be summarized in conclusion—

      As per the survey done through structured questionnaire 95.6 % of the watch Bangladeshi TV channels and the rests of 4.4 % do not watch Bangladeshi TV channels.

      Out of the 500 respondents, who participated in the survey, most of them turned out to be audiences of NTV and their first preference was also NTV as it provides realistic news and quality programs.

      Audiences spend about 60 % time in seeing Bangladeshi channels.

      Preferable time slot of the audiences is 8. 30 pm to 10 pm.

      Most of the audiences mentioned that news is their first preference.

      Most of the audiences stated that NTV are presenting realistic news.

      According to the audiences magazine program Ittady is their most favourite program.

      Talkshow programs are the most disliked by the audiences.

      Audiences want to watch programs with clear picture and sound.

      Audiences want to watch programs that started at the mentioned time.

      Audiences dislike govt. follower programs

      So much commercial Ad is not expected by the audience.

      TV channels involved in public welfare are expected by the audiences.

The 10 television companies those are broadcasting in our country are very alluring and competitive. But to be a realistic and preferable channel in context of the audiences they have to provide according to the demand of the audiences. These TV channels have to provide such programs that the audiences want to watch. TV channels should not concern only about programs but also preferable time slot for the target audiences should be concerned by those TV channels.

We are very pleased to have such a wonderful experience in getting this report to existence, and we feel inculcated to do such a report on such an interesting topic. This study will help us to explore the preferences of the audiences of the TV channels.

read more
EEE

Report on Models for Nanometer Size MESFETs [ Part-2 ]

MESFET stands for Metal Semiconductor Field Effect Transistor. Major objective of this report is to focus on Models for Nanometer Size MESFETs. MESFET offers certain processing and performance advantages, such as low temperature formation of the metal-semiconductor barrier (as compared to a p-n junction made by diffusion or grown process), low resistance and low IR drop along the channel width and good heat dissipation for power devices (the rectifying contact also serve as an efficient thermal contact to heat sink).

Report on Models for Nanometer Size MESFETs [ Part-1 ]

Report on Models for Nanometer Size MESFETs [ Part-2 ]

read more
EEE

Report on Models for Nanometer Size MESFETs [ Part-1 ]

MESFET stands for Metal Semiconductor Field Effect Transistor. Main objective of this report is to focus on Models for Nanometer Size MESFETs. TMESFET offers certain processing and performance advantages, such as low temperature formation of the metal-semiconductor barrier (as compared to a p-n junction made by diffusion or grown process), low resistance and low IR drop along the channel width and good heat dissipation for power devices (the rectifying contact also serve as an efficient thermal contact to heat sink).

Report on Models for Nanometer Size MESFETs [ Part-1 ]

Report on Models for Nanometer Size MESFETs [ Part-2 ]

read more
EEEScience

Report on Digital Communication System

Executive Summery

In this project, Digital Communication System using QPSK Modulation is analyzed and simulated. The main aim of the thesis is to achieve the best digital communication using QPSK modulation and reduce the effect of noises in the communication channel. This thesis details the software implementation of a modern digital communication system and digital modulation methods. The digital modulation schemes considered here include both baseband and Quadrature Phase Shift Keying (QPSK) techniques. The proposed communication system will serve as a practical tool useful for simulating the transmission of any digital data. We use the MATLAB programming to simulate the communication project and simulated portion are attached and discuss briefly. There are some steps of any digital communication model. We discuss each of the steps using necessary diagram and try to understand the reader nicely about digital communication system where we told about Linear Predictive Coding (LPC) in source coding, PLL and all the modulation technique specially the Quadrature Phase Shift Keying (QPSK) in detail for using in the digital communication. The proposed communication system will serve as a practical tool useful for simulating the transmission of any digital data. The various modules of the system include analog to digital converters, digital to analog converters, encoders/decoders and modulators/demodulators. The results show the viability of a QPSK modulated digital communications link.

INTRODUCTION

Communication has been one of the deepest needs of the human race throughout recorded history. It is essential to forming social unions, to educating the young, and to expressing a myriad of emotions and needs. Good communication is central to a civilized society.

The various communication disciplines in engineering have the purpose of providing technological aids to human communication. One could view the smoke signals and drum rolls of primitive societies as being technological aids to communication, but communication technology as we view it today became important with telegraphy, then telephony, then video, then computer communication, and today the amazing mixture of all of these in inexpensive, small portable devices.

Initially these technologies were developed as separate networks and were viewed as having little in common. As these networks grew, however, the fact that all parts of a given network had to work together, coupled with the fact that different components were developed at different times using different design methodologies, caused an increased focus on the underlying principles and architectural understanding required for continued system evolution.

The possible configurations of the link are numerous, so focus was maintained on a typical system that might be used in satellite communications. For this reason convolution channel coders and QPSK modulation were chosen. Additionally, channel effects were primarily modeled as the combination of band laired additive white Gaussian noise (AWGN) and signal attenuation. The results of this link on speech transmission show the various gains and tradeoffs that are realized as data passes through the entire system; the quantitative performance is measured by the probability of bit error, Pe, and the effect various signal to noise ratios have on this probability.

The idea of converting an analog source output to a binary sequence was quite revolutionary in 1948, and the notion that this should be done before channel processing was even more revolutionary. By today, with digital cameras, digital video, digital voice, etc., the idea of digitizing any kind of source is commonplace even among the most technophobic. The notion of a binary interface before channel transmission is almost as commonplace. For example, we all refer to the speed of our internet connection in bits per second.

There are a number of reasons why communication systems now usually contain a binary interface between source and channel (i.e., why digital communication systems are now standard). These will be explained with the necessary qualifications later, but briefly they are as follows:

– Digital hardware has become so cheap, reliable, and miniaturized, that digital interfaces are eminently practical.

– A standardized binary interface between source and channel simplifies implementation and understanding, since source coding/decoding can be done independently of the channel, and, similarly, channel coding/decoding can be done independently of the source.

This thesis studies the Digital Communication System for Quadrature Phase Shift Keying (QPSK) modulation used in digital communications. Software implementation is performed in the MATLAB programming languages and consists of separately coding and interfacing the various functions of the system. By modularizing the various functions which are performed on the data from source to destination, it becomes convenient to change individual sections of the link and model the effects of different transmission conditions on data as it is passed through the channel. The modules of the link include source encoders/decoders, channel encoders/decoders, modulators/demodulators, and channel effects.

ORGANIZATION OF THE THESIS

We use Quadrature Phase Shift Keying (QPSK) Technique in the Digital communication system for better signal transmit and receive in the communication model.

In chapter one, the use and necessary of digital communication in our life has been presented in brief.

In chapter two, we describe the basic digital communication system and channel model which is use in this thesis.

In chapter three, source coding is described briefly. The source encoder is responsible for producing the digital information which will be manipulated by the remainder of the system.

In chapter four, we describe the channel coding in brief and the goal of channel coding is told which allows the detector at the receiver to detect and/or correct errors which might have been introduced during transmission. We use AWGN in the channel coding and it is also presented.

In chapter five, we describe the modulation technique of the digital communication in which Quadrature Phase Shift Keying (QPSK) is described elaborately.

In chapter six, the channel equalization and adaptive filtering are presented in brief.

In chapter seven, we described the demodulation of the communication model used in the thesis.

In chapter eight, we demonstrate the simulation result of QPSK modulation. The software for the simulation, we use the MATLAB platform.

A conclusion was made in chapter nine.

Literature Review

Chapter 2

DIGITAL COMMUNITION MODEL

In this chapter, we describe the basic digital communication system and channel model which is use in this thesis. The model is a simple model of digital communication system. The model is broken into its constituent functions or modules, and each of these is in turn described in terms of its affects on the data and the system. Since this model comprises the entire system, both the source coding and channel equalization are briefly described. In chapters 3 through 8, these two areas will be covered in detail, and the specific algorithms and methods used in the software implementation will be addressed in detail.

We organize this chapter as follows. First, we review some basic notions from digital communications. We present one basic model of digital communication system. We then talk about source encoding and decoding, channel encoding and decoding, modulation, digital interface and channel effects.

2.1 DIGITAL COMMUNICATION

Communication systems that first convert the source output into a binary sequence and then convert that binary sequence into a form suitable for transmission over particular physical media such as cable, twisted wire pair, optical fiber, or electromagnetic radiation through space.

Digital communication systems, by definition,are communication systems that use such a digital sequence as an interface between the source and the channel input (and similarly between the channel output and final destination).

digital-communication-module
Figure 2.1 in the basic digital communication model the first three blocks of the diagram (source encoder, channel encoder, and modulator) together comprise the transmitter .The source represents the message to be transmitted which includes speech, video, image, or text data among others. If the information has been acquired in analog form, it must be converted into digitized form to make our communication easier. This analog to digital conversion (ADC) is accomplished in the source encoder block. Placing a binary interface between source and channel. The source encoder converts the source output to a binary sequence and the channel encoder (often called a modulator) processes the binary sequence for transmission over the channel.

The last three blocks consisting of detector/demodulator, channel decoder, and source decoder form the receiver. The destination represents the client waiting for the information. This might include a human or a storage device or another processing station. In any case, the source decoder’s responsibility is to recover the information from the channel decoder and to transform it into a form suitable for the destination. This transformation includes digital to analog conversion (DAC) if the destination is a human waiting to hem or view the information or if it is an analog storage device. If the destination is a digital storage device, the information will be kept in its digital state without DAC. The channel decoder (demodulator) recreates the incoming binary sequence (hopefully reliably), and the source decoder recreates the source output.

2.2 SOURCE ENCODING AND ECODING

The source encoder and decoder in Figure 2.1 have the function of converting the input from its original form into a sequence of bits. As discussed before, the major reasons for this almost universal conversion to a bit sequence are as follows: inexpensive digital hardware, standardized interfaces, layering, and the source/channel separation theorem.
The simplest source coding techniques apply to discrete sources and simply involve representing each successive source symbol by a sequence of binary digits. For example, letters from the 27symbol English alphabet (including a space symbol) may be encoded into 5-bit blocks. Since there are 32 distinct 5-bit blocks, each letter may be mapped into a distinct 5-bit block with a few blocks left over for control or other symbols. Similarly, upper-case letters, lower-case letters, and a great many special symbols may be converted into 8-bit blocks (“bytes”) using the standard ASCII code.

For example the input symbols might first be segmented into m – tupelos, which are then mapped into blocks of binary digits. More generally yet, the blocks of binary digits can be generalized into variable-length sequences of binary digits. We shall find that any given discrete source, characterized by its alphabet and probabilistic description, has a quantity called entropy associated with it. Shannon showed that this source entropy is equal to the minimum number of binary digits per source symbol required to map the source output into binary digits in such a way that the source symbols may be retrieved from the encoded sequence.

Some discrete sources generate finite segments of symbols, such as email messages, that are statistically unrelated to other finite segments that might be generated at other times. Other discrete sources, such as the output from a digital sensor, generate a virtually unending sequence of symbols with a given statistical characterization. The simpler models of Chapter 2 will correspond to the latter type of source, but the discussion of universal source coding is sufficiently general to cover both types of sources, and virtually any other kind of source.

The most straight forward approach to analog source coding is called analog to digital (A/D) conversion.

2.3 CHANNEL ENCODING AND DECODING

The channel encoder and decoder box in Figure 2.1 has the function of mapping the binary sequence at the source/channel interface into a channel waveform.

One of the advantages of digital communications over analog communications is its robustness during transmission. Due to the two state nature of binary data (i.e. either a 1 or a 0), it is not as susceptible to noise or distortion as analog data. While even the slightest noise will corrupt an analog signal, small mounts of noise will generally not be enough to change the state of a digital signal from I to 0 or vice versa and will in fact be ‘ignored’ at the receiver while the correct information is accurately recovered.
Nevertheless, larger amounts of noise and interference can cause a signal to be demodulated incorrectly resulting in a bit stream with errors at the destination. Unlike an analog system, a digital system can reduce the effect of noise by employing an error control mechanism which is used prior to modulation. The channel encoder performs this error control by systematically introducing redundancy into the information bit stream after it has been source encoded but prior to its transmission. This redundancy can then be used by the receiver to resolve errors that might occur during transmission due to noise or interference.

The channel decoder performs the task of decoding the received coded bit stream by means of a decoding algorithm tailored for the encoding scheme. Error control of this variety that allows a receiver to resolve errors in a bit stream by decoding redundant information introduced at the transmitter is known as Forward Error Correction (FEC). The price paid for employing FEC is the increased bit rate and complexity of the transmitter and receiver.

2.4 MODULATION

The digital modulator serves as an interface between the transmitter and the channel. It serves the purpose of mapping the binary digital information it receives into waveforms compatible with the channel. In baseband modulation, the output waveforms we simple voltage pulses which take predefined values corresponding to a 1 or 0. However, many channels, such as a satellite channel, are not suited for backhand communication and require the incoming data to be modulated to a higher frequency, referred to as the carrier frequency, so it can be converted to an electromagnetic wave that will propagate through space to its destination ( a satellite or a ,round station) This type of modulation, known as band pass modulation, varies one of the following three parameters of the carrier frequency based on the incoming digital bit stream: amplitude, frequency or phase. These modulation types are commonly known as Amplitude Shift Keying (ASK). Frequency Shift Keying (FSK) and Phase Shift Keying (PSK) respectively.

The digital detector/demodulator reverses the process and extracts the binary baseband information from the received modulated signal which has been subjected to noise, interference, loss, and other distortions. The demodulator produces a sequence of binary values which are estimates of the transmitted data and passes it on to the channel decoder.

2.5 DIGITAL INTERFACE

The interface between the source coding layer and the channel coding layer is a sequence of bits. However, this simple characterization does not tell the whole story. The major complicating factors are as follows:

– Unequal rates: The rate at which bits leave the source encoder is often not perfectly matched to the rate at which bits enter the channel encoder.

– Errors: Source decoders are usually designed to decode an exact replica of the encoded sequence, but the channel decoder makes occasional errors.

– Networks: Encoded source outputs are often sent over networks, traveling serially over several channels; each channel in the network typically also carries the output from a number of different source encoders.

The first two factors above appear both in point-to-point communication systems and in networks. They are often treated in an ad hoc way in point-to-point systems, whereas they must be treated in a standardized way in networks. The third factor, of course, must also be treated in a standardized way in networks.

2.6 CHANNEL EFFECTS

During transmission, the signal undergoes various degrading and distortion effects as it passes through the medium from the transmitter to the receiver. This medium is commonly referred to as the channel. Channel effects include, but are not limited to, noise, interference, linear and non linear distortion and attenuation. These effects are contributed by a wide variety of sources including solar radiation, weather and signals front adjacent channels. But many of the prominent effects originate from the components in the receiver. While many of the effects can be greatly reduced by good system design, careful choice of filter parameters, and coordination of frequency spectrum usage with other users, noise and attenuation generally cannot be avoided and are the largest contributors to signal distortion.

In digital communication systems, a common quantity used to determinate whether a signal will be detected correctly is the ratio of energy per bit to spectral noise power density, Eb / No, measured at the detector. The higher the Eb, the lower the resulting bit error rate (BER), the probability of bit error, Pb Unfortunately, a high Eb demands greater power consumption at the transmitter; in some cases, it may be unfeasible to obtain a high Eb due to transmitter size or power limitations as in the case of satellite transmission.

The digital communication system described consists of an ordered grouping of various modules which operate on an input data sequence. In practice, these modules or resources are not dedicated to a single source/destination, but they me shared by multiple sources and their destinations to achieve optimum utilization.

In a digital system, the transmission bit rate is an important system resource. A given information source of bandwidth B, sampled at 2B samples/second using q bits per sample results in a data rate, R, of 2Bq bits per second. With a compression ratio C, the data rate from the source encoder is Rs = RIC bits per second. Channel coding by a factor n leads to a coded data rate of Rc = Rs n bits per second; R, is the system transmission bit rate. These bits we then used by the modulator to form the transmission waveforms which have to be accommodated within the available bandwidth. At the receiver these steps m performed in the reverse order to recover the information sequence.

Chapter 3

SOURCE CODING

In the digital communication system model described previously, the source encoder is responsible for producing the digital information which will be manipulated by the remainder of the system. After the digital signal is acquired from the analog information, the source encoder subjects it to a wide range of processing functions, the goals of which are to compactly represent the information. Speech, image, and textual information each have their own unique characteristics that require different source encoding techniques. Depending on the information source, different digital signal processing functions are implemented to remove the redundancies inherent in the given signal. The specifics of the speech compression techniques used in this thesis are detailed below.

In this chapter we describe the source coding and then its related speech compression, Linear predictive coding (LPC) and Code excited linear prediction (CELP).The use of these in digital communication in source coding. And we also describe the LPC in large as we use it in the source coding in our digital communication thesis.

3.1 SPEECH COMPRESSION

Since the frequency content of spoken language is confined to frequencies under 4000 Hz, it is reasonable to use a sampling frequency of 8000 Hz. Using 16 bit linear Pulse code modulation (PCM) as the quantization method results in a bit rate of 128 kbps. Subsequent analysis, coding, and compression of speech are performed on segments or frames of 20 to 30 ms duration.

There are two broad categories of speech coding/compression. Both categories are concerned with representing the speech with the minimum number of applicable parameters while also allowing the speech to be intelligibly reproduced; both are loss in nature.

The first category deals with waveform coders which manipulate quantities in the speech signal’s frequency representation. Typical analysis tools of waveform coders are the Discrete Fourier Transform (DFT) and the Discrete Wavelet Transform (DWT), both of which transform the time signal to its frequency domain representation. In this case, compression might potentially be achieved by retaining the frequency components with the largest magnitudes.

The second category of speech compression deals with voice coders, or vocoders for short. Vocoders attempt to represent speech as the output of a linear system driven by either periodic or random excitation sequences as shown in Figure 3.1.

basic-model-of-vocoder
A periodic impulse train or a white noise sequence, representing voiced or unvoiced speech, drives an all pole digital filter to produce the speech output. The all pole filter digital filter models the vocal tract.

Additionally, estimates of the pitch period and gain parameters are necessary for accurate reproduction of the speech. Due to the slowly changing shape of the vocal tract over time, vocoders successfully reproduce speech by modeling the vocal tract independently for each frame of speech and driving it by an estimate of a separate input excitation sequence for that frame. Most vocoders differ in performance principally based on their methods of estimating the excitation sequences.

3.2 LINEAR PREDICTIVE CODING (LPC)

Linear Predictive Coding (LPC) is one of the most powerful speech analysis techniques, and one of the most useful methods for encoding good quality speech at a low bit rate. It provides extremely accurate estimates of speech parameters, and is relatively efficient for computation. This document describes the basic ideas behind linear prediction, and discusses some of the issues involved in its use.

Linear prediction model speech waveforms are same by estimating the current value from the previous values. The predicted value is a linear combination of previous values. The linear predictor coefficients are determined such that the coefficients minimize the error between the actual and estimated signal. The basic equation of linear prediction is given as follows:
aaa
theory
LPC starts with the assumption that the speech signal is produced by a buzzer at the end of a tube. The glottis (the space between the vocal cords) produces the buzz, which is characterized by its intensity (loudness) and frequency (pitch). The vocal tract (the throat and mouth) forms the tube, which is characterized by its resonances, which are called formants. For more information about speech production, see the Speech Production OLT.
LPC analyzes the speech signal by estimating the formants, removing their effects from the speech signal, and estimating the intensity and frequency of the remaining buzz. The process of removing the formants is called inverse filtering, and the remaining signal is called the residue.
The numbers which describe the formants and the residue can be stored or transmitted somewhere else. LPC synthesizes the speech signal by reversing the process: use the residue to create a source signal, use the formants to create a filter (which represents the tube), and run the source through the filter, resulting in speech.
Because speech signals vary with time, this process is done on short chunks of the speech signal, which are called frames. Usually 30 to 50 frames per second give intelligible speech with good compression.

A. Speech Production

When a person speaks, his or her lungs work like a power supply of the speech production system. The glottis supplies the input with the certain pitch frequency (F0). The vocal tract, which consists of the pharynx and the mouth and nose cavities, works like a musical instrument to produce a sound. In fact, different vocal tract shape would generate a different sound. To form different vocal tract shape, the mouth cavity plays the major role. To produce nasal sounds, nasal cavity is often included in the vocal tract. The nasal cavity is connected in parallel with the mouth cavity. The simplified vocal tract is shown in Fig 3.2.

vocal-tract
The glottal pulse generated by the glottis is used to produce vowels or voiced sounds. And the noise-like signal is used to produce consonants. ..or unvoiced sounds.

B. Linear Prediction Model

An efficient algorithm known as the Levinson-Durbin algorithm is used to estimate the linear prediction coefficients from a given speech waveform.

Assume that the present sample of the speech is predicted by the past M samples of the speech such that

Where the prediction of is is the kth step previous sample, and ak are called the linear prediction coefficients.

The transfer function is given by

Because ε(n), residual error, has less standard deviation and less correlated than speech itself, smaller number of bits is needed to quantize the residual error sequence. Equation can be rewritten as the difference equation of a digital filter whose input is ε (n) and output is s (n) such that

The implementation of the above equation is called the synthesis filter and is shown in Figure 3.5.

If both the linear prediction coefficients and the residual error sequence are available, the speech signal can be reconstructed using the synthesis filter. In practical speech coders, linear prediction coefficients and residual error samples need to be compressed before transmission. Instead of quantizing the residual error, sample by sample, several important parameters such as pitch period, code for a particular excitation, etc are transmitted. At the receiver, the residual error is reconstructed from the parameters.

3.3 CODE EXCITED LINEAR PEDICTION (CELP)

Although the data rate of plain LPC coders is low, the speech reproduction, while generally intelligible, has a metallic quality, and the vocoder artifacts are readily apparent in the unnatural characteristics of the sound. The reason for this is because this algorithm does not attempt to encode the excitation of the source with a high degree of accuracy. The CELP algorithm attempts to resolve this issue while still maintaining a low data rate.

Speech frames in CELP are 30 ms in duration, corresponding to 240 samples per frame using a sampling frequency of 8000 Hz. They are further partitioned into four 7.5 ms sub frames of 60 samples each. The bulk of the speech analysis/synthesis is performed over each sub frame.

The CELP algorithm uses two indexed codebooks and three lookup tables to access excitation sequences, gain parameters, and filter parameters. The two excitation sequences are scaled add summed to form the input excitation to a digital filter created from the LPC filter parameters. The codebooks consist of sequences which are each 60 samples long, corresponding to the length of a sub frame.

CELP is referred to as an analysis by synthcsis technique.
celp-analyzer
Figure 3.6 shows a schematic diagram of the CELP analyzer/coder. The stochastic codebook is fixed containing 512 zero mean Gaussian sequences. The adaptive codebook has 256 sequences formed from the input sequences to the digital filter and updated every two sub frames. A code from the stochastic codebook is scaled and summed with a gain scaled code from the adaptive codebook.

The result is used as the input excitation sequence to an LPC synthesis filter. The output of the filter is compared to the actual speech signal, and the weighted error between the two is compared to the weighted errors produced by using all of the other codewords in the two codebooks. The codebook indices of the two codewords (one each from the stochastic add adaptive codebooks), along with their respective gains, which minimize the error are then coded for transmission along with the synthesis filter (LPC) parameters. Because, the coder passes each of the adaptive and stochastic codewords through the synthesis filter before selecting the optimal codewords.

Chapter 4

CHANNEL CODING

We considered the problem of digital modulation by means of M=2k signal waveforms, where each waveform conveys k bits of information. We observed that some modulation methods provide better performance than others. In particular, we demonstrated that orthogonal signaling waveforms allow us to make the probability of error arbitrarily mail by letting the number of waveforms M → ∞ provided that the SNR per bit γb ≥ 1.6 dB. Thus, we can operate at the capacity of the Additive White Gaussian Noise channel in the limit as the bandwidth expansion factor Be =W/R→∞. This is a heavy price to pay, because Be grows exponentially with the block length k. Such inefficient use of channel bandwidth is highly undesirable.

In this and the following chapter, we consider signal waveforms generated from either binary or no binary sequences. The resulting waveforms are generally characterized by a bandwidth expansion factor that grows only linearly with k. Consequently, coded waveforms offer the potential for greater bandwidth efficiency than orthogonal M ary waveforms. We shall observe that. In general, coded waveforms offer performance advantages not only in power limited applications where RIW<1, but also in bandwidth limited systems where R/W > 1.

We begin by establishing several channel models that will be used to evaluate the benefits of channel coding, and we shall introduce the concept of channel capacity for the various channel models, then, we treat the subject of code design for efficient communications.

4.1 CHANNEL MODEL

In the model of a digital communication system described in chapter 2, we recall that the transmitter building block; consist of the discrete input, discrete output channel encoder followed by the modulator. The function of the discrete channel encoder is to introduce, in a controlled manner, some redundancy in the binary information sequence, which can be used at the receiver to overcome the effects of noise and interference encountered in the transmission of the signal through the channel. The encoding process generally involves taking k information bits at a time and mapping each k bit sequence into a unique n bit sequence, called a code word. The amount of redundancy introduced by the encoding of the data in this manner is measured by the ratio n/k. The reciprocal of this ratio, namely k/n, is called the code rate.

The binary sequence at the output of the channel encoder is fed to the modulator, which serves as the interface to the communication channel. As we have discussed, the modulator may simply map each binary digit into one of two possible waveforms, i.e., a 0 is mapped into s1 (t) and a 1 is mapped into S2 (t). Alternatively, the modulator may transmit q bit blacks at a time by using M = 2q possible waveforms.

At the receiving end of the digital communication system, the demodulator processes the channel crurrupted waveform and reduces each waveform to a scalar or a vector that represents an estimate of the transmitted data symbol (binary or M ary).The detector, which follows the demodulator, may decide on whether the ‘transmitted bit is a 0 or a 1. In such a case, the detector has made a hard decision. If we view the decision process at the detector as a form of quantization, we observe that a hard decision corresponds to binary quantization of the demodulator output. More generally, we may consider a detector that quantizes to Q > 2 levels, i.e. a Q ary detector. If M ary signals are used then Q ≥ M. In the extreme case when no quantization is performed, Q = M. In the case where Q > M, we say that the detector has made a soft decision.

A. Binary Symmetric Channel

Figure 4.1: A composite discrete-input, discrete output channel

Let us consider an additive noise channel and let the modulator and the demodulator/detector be included as parts of the channel. If the modulator employs binary waveforms and the detector makes hard decisions, then the composite channel, shown in Fig. 4.1, has a discrete-time binary input sequence and a discrete-time binary output sequence. Such a composite channel is characterized by the set X = {0, 1} of possible inputs, the set of Y= {0, 1} of possible outputs, and a set of conditional probabilities that relate the possible outputs to the possible inputs. If the channel noise and other disturbances mum statistically independent errors in the transmitted binary sequence with average probability P then,

P(Y = 0 / x = 1) = P(Y = 1 / x = 0) = P

P(Y = 1 / x = 1) = P(Y = 0 / X = 0) = 1- P
Thus, we have reduced the cascade of the binary modulator, the waveform channel, and the binary demodulator and detector into an equivalent discrete-time channel which is represented by the diagram shown in Fig 4.1. This binary-input, binary-output, symmetric channel is simply called a binary symmetric channel (BSC).

B. Discrete Memory Less Channel

The BSC is a special can of a more general discrete-input, discrete-output channel. Suppose that the output form the channel encoder are q ary symbols, i.e., X={x0, x1,…,xq -1) and the output of the decoder consists of q ary symbols, where Q ≥M =2q.

Figure 4.2: Binary symmetric channels

If the channel and the modulation are memory less, then the input-output characteristics of the composite channel, shown in Fig. 4.1, are described by a set of qQ conditional probabilities.

C. Waveform Channels

We may separate the modulator and demodulator from the physical channel, and consider a channel model in which the inputs are waveforms and the outputs are waveforms. Let us assume that such a channel has a given bandwidth W, with ideal frequency response C(f) =1 within the bandwidth W, and the signal at its output is corrupted by additive white Gaussian noise. Suppose that x (t) is a band-limited input to such a channel and y (t) is the corresponding output, then,

y(t) = x(t) + n(t)

Where n(t) represents a sample function of the additive noise process.

4.2 CONVOLUTIONAL CODES

For (n,1) convolution codes, each bit of the information sequence into the encoder results in an output of n bits. However, unlike block codes, the relationship between information bits and output bits is not a simple one-to-one mapping. In fact, each input information bit is ‘convolved’ with K-1 other information bits to form the output n bit sequence. The value K is known as the constraint length of the code and is directly related to its encoding and decoding complexity as described below in a brief explanation of the encoding process.

For each time step, an incoming bit is stored in a K stage shift register, and bits at predetermined locations in the register are passed to n modulo 2 adders to yield the n output bits. Each input bit enters the first stage of the register, and the K bits already in the register are each shifted over one stage with the last bit being discarded from the last stage.

The n output bits produced by the entry of each input bit have a dependency on the preceding K-1 bits. Similarly, since it is involved in the encoding of K-1 input bits in addition to itself, each input bit is encoded in nK output bits. It is in this relationship that convolutional coding derives its power. For larger values of K, the dependencies among the bits increased the ability to correct more errors rises correspondingly. But the complexity of the encoder and especially of the decoder also becomes greater.

convolutional code encoder
Shown in Figure 4.3 is the schematic for a (2,1) encoder with constraint length K= 3 which will serve as the model for the remainder of the development of convolutional coding. In the coder shown, the n = 2 output bits are formed by modulo 2 addition of the bits in stages one and three and the addition of bits in stages one, two, and three of the shift register.

Chapter 5

MODULATION

In this chapter, we describe the basic Modulation Technique and emphasis on QPSK Modulation which is use in this thesis. We are trying to show how QPSK Modulation is used in digital communication system. In digital transmission systems, the data sequence from the channel encoder is partitioned into L bit words, and each word is mapped to one of M corresponding waveforms according to some predetermined rule, where M = 2L. We shall see later, in a QPSK modulation system, the incoming sequence is separated into words of L = 2 bits each and mapped to M = 22 = 4 different waveforms. During transmission, the channel causes attenuation and introduces noise to the signal. The net result is the formation of a version of the original signal which may not be detected correctly by the receiver. If the errors are too numerous, the channel decoder may not be able to resolve the information correctly. Baseband modulation using the simple binary symmetric channel model is briefly discussed, and the details of QPSK modulation are then presented.

We organize this chapter as follows. First, we review some basic from Modulation Technique. We present basic modulation of Amplitude Shift-keying (ASK), Frequency Shift-keying(FSK),Phase Shift-keying(PSK), Binary Phase Shift-keying (BPSK) and Quadrature Phase Shift-keying(QPSK). We then talk about Quadrature Phase Shift-keying(QPSK) in detail and try to show the use of QPSK in digital communication system.

5.1 AMPLITUDE SHIFT KEYING (ASK)

In many situations, for example in radio frequency transmission, data cannot be transmitted directly, but must be used to modulate a higher frequency sinewave carrier. The simplest way of modulating a carrier with a data stream is to change the amplitude of the carrier every time the data changes. This technique is known as amplitude shift -keying.

The simplest form of amplitude shift-keying is on- off keying, where the transmitter outputs the sinewave carrier whenever the data bit is a ‘1’, and totally suppresses the carrier when the data bit is ‘0’. In other words, the carrier is turned ‘on’ for a ‘1’, and ‘off ‘ for a ‘0’.This form of amplitude shift-keying is illustrated in figure below:

Figure 5.1: an ASK signal (below) and the message (above)

In order to generate an amplitude shift-keyed (ASK) wave form at the Transmitter a balanced modulator circuit is used (also known as a linear multiplier). This device simply multiplies together the signals at its two inputs, the output voltage at any instant in time being the product of the two input voltages. One of the inputs is a.c. coupled; this is known as the carrier input. The other is d.c. coupled and is known as the modulation (or signal) input.

In order to generate the ASK waveform, all that is necessary is to connect the sine wave carrier to the carrier input, and the digital data stream to the modulation input, as shown in figure below:

Figure 5.2: ASK generation method

The data stream applied to the modulator’s modulation input is unipolar, i.e. its ‘0’ and ‘1’ levels are 0 volts and +5volts respectively. Consequently.

(1) When the current data bit is a ‘1’ , the carrier is multiplied by a constant, positive voltage, causing the carrier to appear, unchanged in phase, at the modulator’s output.

(2) When the current data bit is a ‘0’, the carrier is multiplied by 0 volts, giving 0 volt as at the modulators output.

At the Receiver, the circuitry required to demodulate the amplitude shift- keyed wave form is minimal.The filter’s output appears as a very rounded version of the original data stream, and is still unsuitable for use by the “Receiver’s digital circuits. To overcome this, the filter’s output wave form is squared up by a voltage comparator.

5.2 Frequency Shift-keying

In frequency shift -keying, the signal at the Transmitter’s output is switched from one frequency to another every time there is a change in the level of the modulating data stream For example, if the higher frequency is used to represent a data ‘1’ and the lower ferquency a data ‘0’, the reasulting Frequency shift keyed (FSK) waveform might appear as shown in Figure below:

Figure 5.3 An ASK waveform

The generations of a FSK waveform at the Transmitter can be acheived by generating two ASK waveforms and adding them together with a summing amplifier.

At the Receiver, the frequency shift-keyed signal is decoded by means of a phase-locked loop (PLL) detector. The detector follows changes in frequency in the FSK signal, and generates an output voltage proportional to the signal ferquency.

The phase-locked loop’s output also contains components at the two carrier frequencies; a low-pass fillter is used to filter these components out.

The filter’s output appears as a very rounded version of the original data stream, and is still unsuitable for use by the Receiver’s digital circuits. To overcome this, the filter’s output waveform is squared up by a voltage comparator. Figure below shows the functional blocks required in order to demodulate the FSK waveform at the Receiver.

5.3 Phase Shift keying (PSK)

In phase shift keying the phase of the carrier sinewave at the transmitter’s output is switched between 0 º and 180 º, in sympathy with the data to be transmitted as shown in figure below:

Figure 5.3: phase shift keying

The functional biocks required in order to generate the PSK signal are similar to those required to generate an ASK signal. Again a balanced modulator is used, with a sinewave carrier applied to its carrier input. In contscast to ASK generation, however, the digital signal applied to the madulation input for PSK generation is bipolar, rather than unipolar, that is it has equal positive and negative voltage levels.

When the modulation input is positive, the modulator multiplies the carier input by this constant level. so that the modulator’s output signal is a sinewave which is in phase with the carrier input.

When the modulation input is negative, the modulator multiplies the carrier input by this constant level, so that the modulatior’s autput signal is a sinewave which is 180 º out of phase with the carier input.

At the Receiver, the frequency shift-keyed signal is decoded by means of a squaring loop detector. This PSK Demodulator is shown in figure below:

5.4 BINARY PHASE-SHIFT KEYING (BPSK)

In binary phase shift keying (BPSK), the transmitted signal is a sinusoid of fixed amplitude it has one fixed phase when the data is at one level and when the data is at the other level the phase is different by 180 º . If the sinusoid is of Amplitude A it has a power :

Ps = 1/2 A2
A = Root over (2 Ps)

BPSK(t) = Root over (2 Ps) Cos (ω0t)
BPSK(t) = Root over (2 Ps) Cos (ω0t+π )
= – Root over (2 Ps) Cos (ω0t)

In BPSK the data b(+) is a stream of binary digits with voltage levels which, we take to be at +1V and – 1 V. When b(+) =1V we say it is at logic 1 and when b(+)= -1V we say it is logic 0. Hence, BPSK(t) can be written as:

BPSK(t) = b(t) Root over (2 Ps) Cos (w0t)

In practice a BPSK signal is generated by applying the waveform Coswo as a carrier to a balanced modulator and applying the baseband signal b(+) as the modulating signal. In this sense BPSK can be thought of as an AM signal similar as PSK signal.

5.5 Quadrature Phase Shift Keying (QPSK)

In this section the topics of QPSK modulation of digital signals including their transmission, demodulation, and detection, are developed. The material in this section and the related coding of this system are both based on transmission using an AWGN channel model which is covered at the end of this section. Some of the techniques discussed below are specifically designed for robustness under these conditions.

Because this is a digital implementation of a digital system, it is important to note that the only places where analog quantities occur are after the DAC, prior to the actual transmission of the signal, and before the ADC at the receiver. All signal values between the source encoder input and modulator output are purely digital. This also holds for all quantities between the demodulator and the source decoder.

A. Background

QPSK modulation is a specific example of the more general M ary PSK. For M ary PSK, M different binary words of length L = log2 M bits are assigned to M different waveforms. The waveforms we at the same frequency but separated by multiples of φ = 2π/M in phase from each other and can be represented as follows:

, =

with i = 1, 2, … M. The carrier frequency and sampling frequency are denoted by fc and fs respectively.

Since an M ary PSK system uses L bits to generate a waveform for transmission, its symbol or baud rate is 1IL times its bit rate. For QPSK, there we M = 4 waveforms separated by multiples of ( = ) radians and assigned to four binary words of length L = 2 bits. Because QPSK requires two incoming bits before it can generate a waveform, its symbol or baud rate, D, is one half of its bit rate, R.

B. Transmitter

Figure 5.2 illustrates the method of QPSK generation. The first step in the formation of a QPSK signal is the separation of the incoming binary data sequence, b, into an in phase bit stream, b1, and a quadratic phase bits ream, bQ, as follows. If the incoming data is given by b = bo, b1, b2, b3, b4…. where bi are the individual bits in the sequence, then, bI = bo, b2, b4 ……(even bits of b) and bQ= b1, b3, b5 …… (odd bits). The digital QPSK signal is created by summing a cosine function modulated with the bI, stream and a sine function modulated by the bQ stream. Both sinusoids oscillate at the same digital frequency, ω0=2π fc / fs radians. The QPSK signal is subsequently filtered by a band pass filter, which will be described later, and sent to a DAC before it is finally transmitted by a power amplifier.

Figure 5.4 QPSK Modulator
B.1 Signal Constellation

It is often helpful to represent the modulation technique with its signal space representation in the I Q plane as shown in Figure 5.3. The two axes, I and Q, represent the two orthogonal sinusoidal components, cosine and sine, respectively, which are added together to form the QPSK signal as shown in Figure 5.2. The four points in the plane represent the four possible QPSK waveforms and me separated by multiples of n/2 radians from each other. By each signal point is located the input bit pan which produces the respective waveform. The actual I and Q coordinates of each bit pair are the contributions of the respective sinusoid to the waveform. For example, the input bits (0, 1) in the second quadrant correspond to the (I,Q) coordinates, ( 1,1). This yields the output waveform I + Q = cos (ω0n) + sin (ω0n). Because all of the waveforms of a QPSK have the same amplitude, all four points are equidistant from the origin. Although the two basis sinusoids shown in Figure 5.2 are given by cos (ω0n) and sin (ω0n), the sinusoids can be my two functions that are orthogonal.

Figure 5.3 Signal Constellation of QPSK

B.2 Filtering

The QPSK signal created by the addition of the two sinusoids has significant energy in frequencies above and below the carrier frequency. This is due to the frequency contributions incurred during transitions between symbols which are either 90 degrees or 180 degrees out of phase with each other. It is common to limit the out of band power by using a digital band pass filter (BPF) centered at ωo. The filter has a flat pass band and a bandwidth which is 1.2 to 2 times the symbol rate.

C. Receiver

The receiver’s function consists of two steps: demodulation and detection. Demodulation entails separating the received signal into its constituent components. For a QPSK signal, these are the cosine and sine waveforms carrying the bit information. Detection is the process of determining the sequence of ones and zeros those sinusoids represent.

C.1 Demodulator

The demodulation procedure is illustrated below in Figure 5.4. The first step is to multiply the incoming signal by locally generated sinusoids. Since the incommoding signal is a sum of sinusoids, and the receiver is a linear system, the processing of the signal can be treated individually for both components and summed upon completion.

Figure 5.4: QPSK Demodulator and Detector

Assuming the received signal is of the form

r(n) = AI cos(ω0 n) + AQ sin (ω0 n)

where AI and AQ are scaled versions of the bI and bQ bitstreams used to modulate the signal at the transmitter. The contributions through the upper and lower arms of the demodulator due to the cos(ω0 n) input alone are

rci = AI cos(ω0 n) cos (ω0 n+ ө)

rcQ = AI cos(ω0 n) sin (ω0 n+ ө)

where ө is the phase difference between the incoming signal and locally generated sinuso¬ids. These equations can be expanded using trigonometric identities to yield.

C.2 Detection

After the signal r(n) has been demodulated into the bitstreams dj(n) and dQ(n), the corresponding bit information must be recovered. The commonly used technique is to use a matched filter at the output of each LPF as shown in Figure 5.4. The matched filter is an optimum receiver under AWGN channel conditions and is designed to produce a maximum output when the input signal is a min or image of the impulse response of the filter. The outputs of the two matched filters are the detected bitstreams bdj and bdO, and they are recombined to form the received data bitstream. The development of the matched filter and its statistical properties as an optimum receiver under AWGN conditions can be found in various texts.

5.6 AWGN Channel

The previously introduced BSC channel modeled all of the channel effects with one parameter, namely the BER; however, this model is not very useful when attempting to more accurately model a communication system’s behavior. The biggest drawback is the lack of emphasis given to the noise which significantly corrupts all systems.

The most commonly used channel model to deal with this noise is the additive white Gaussian noise (AWGN) channel model. The time results because the noise is simply added to the signal while the term ‘white’ is used because the frequency content is equal across the entire spectrum. In reality, this type of noise does not exist and is confined to a finite spectrum, but it is sufficiently useful for systems whose bandwidths are small when compared to the noise power spectrum.

Chapter 6

CHANNEL EQUALIZATION

Equalization is partitioned into two broad categories. The first category, maximum likelihood sequence estimation (MLSE), entails making measurements of impulse response and then providing a means for adjusting the receiver to the transmission environment. The goal of such adjustment is to enable the detector to make good estimates from the demodulated distorted pulse sequence. With an MLSE receiver, the distorted samples are not reshaped or directly compensated in any way; instead, the mitigating techniques for MLSE receiver is to adjust itself in such a way that it can better deal with the distorted samples such as Viterbi equalization.
The second category, equalization with filters, uses filters to compensate the distorted pulses. In this second category, the detector is presented with a sequence of demodulated samples that the equalizer has modified or cleaned up from the effects of ISI. The filters can be distorted as to whether they are linear devices that contain only feed forward elements (transversal equalizer), or whether they are nonlinear devices that contain both feed for ward and feedback elements (decision feedback equalizer) the can be grouped according to the automatic nature of their operation, which may either be preset or adaptive.
They are also grouped according to the filter’s resolution or update rate.
Symbol spaced
Pre detection samples provided only on symbol boundaries, that is, one sample per symbol. If so, the condition is known.
Fractionally spaced
Multiple samples provided for each symbol. If so, this condition is known.

6.1 ADAPTIVE EQUALIZATION
An adaptive equalizer is an equalization filter that automatically adapts to time-varying properties of the communication channel. It is frequently used with coherent modulations such as phase shift keying, mitigating the effects of multipath propagation and Doppler spreading. Many adaptation strategies exist. A well-known example is the decision feedback equalizer, a filter that uses feedback of detected symbols in addition to conventional equalization of future symbols. Some systems use predefined training sequences to provide reference points for the adaptation process.
Adaptive equalization is capable of tracking a slow time varying channel response. It can be implemented to perform tap weight adjustments periodically or continually. Periodic adjustments are accomplished by periodically transmitting a preamble or short training sequence of digital data that is known in advance by the receiver. The receiver also detects the preamble to detect start of transmission, to set the automatic gain control level, and to align internal clocks and local oscillator with the received signal. Continual adjustments are accomplished by replacing the known training sequence with a sequence of data symbol estimated from the equalizer output and treated as known data. When performed continually and automatically in this way, the adaptive procedure is referred to as decision directed. Decision directed only addresses how filter tap weights are adjusted-that is with the help of signal from the detector. DFE, however, refers to the fact that there exists an additional filter that operates on the detector output and recursively feed back a signal to detector input. Thus with DFE there are two filters, a feed forward filter and a feed back filter that processes the data and help mitigate the ISI.
Adaptive equalizer particularly decision directed adaptive equalizer, successfully cancels ISI when the initial probability of error exceeds one percent. If probability of error exceeds one percent, the decision directed equalizer might not converge. A common solution to this problem is to initialize the equalizer with an alternate process, such as a preamble to provide good channel error performance, and then switch to the decision directed mode. To avoid the overhead represented by a preamble many systems designed to operate in a continuous broadcast mode use blind equalization algorithms to form initial channel estimates. These algorithms adjust filter coefficients in response to sample statistics rather than in response to sample decisions.
Automatic equalizer use iterative techniques to estimate the optimum coefficients. The simultaneous equations do not include the effects of channel noise. To obtain a stable solution to the filter weights, it is necessary that the data are average to obtain, stable signal statistics or the noisy solution obtained from the noisy data must be averaged considerations of algorithm complexity and numerical stability most often lead to algorithms that average noisy solutions. The most robust of this class of algorithm is the least mean square algorithm.
6.2 LMS ALGORITHM FOR OEFICIENT ADJUSTMENT

Suppose we have an FIR filter with adjustable coefficient {h(k),0<k<N-1}. Let x(n) denote the input sequence to the filter, and let the corresponding output be {y(n)}, where
y(n) = n=0,….M

Suppose we also have a desired sequence d(n) with which we can compare the FIR filter output. Then we can form the error sequence e(n) by taking the difference between d(n) and y(n). That is,
e(n)=d(n)-y(n), n=0,….M
The coefficient of FIR filter will be selected to minimize the sum of squared errors.
Thus we have

+
where, by definition,
rdx(k)= 0 ≤ k ≤ N-1
rxx(k)= 0 ≤ k ≤ N-1
We call rdx(k) the cross correlation between the desired output sequence d(n) and the input sequence x(n), and rxx(k) is the auto correlation sequence of x(n).
The sum of squared errors ε is a quadratic function of the FIR filter coefficient. Consequently, the minimization of ε with respect to filter coefficient h(k) result in a set of linear equations. By differentiating ε with respect to each of the filter coefficients, we obtain,

∂ε /∂h(m)=0, 0 ≤ m ≤ N-1
and, hence
rxx(k-m)=rdx(m), 0 ≤ k ≤ N-1
This is the set of linear equations that yield the optimum filter coefficients.
To solve the set of linear equations directly, we must first compare the autocorrelation sequence rxx(k) of the input signal and cross correlation sequence rdx(k) between the desired sequence d(n) and input sequence x(n).
The LMS provides an alternative computational method for determining the optimum filter coefficients h(k) without explicitly computing the correlation sequences rxx(k) and rdx(k). The algorithm is basically a recursive gradient (steepest-descent) method that finds the minimum of ε and thus yields the optimum filter coefficients.
We begin with the arbitrary choice for initial values of h(k), say h0(k). For example we may begin with h0(k)=0, 0 ≤ k ≤ N-1,then after each new input sample x(n) enters the adaptive FIR filter, we compute the corresponding output, say y(n), from the error signal e(n)=d(n)-y(n), and update the filter coefficients according to the equation
hn(k)=hn-1(k)+ Δ.e(n).x(n-k), 0 ≤ k ≤ N-1, n=0,1,…..
where Δ is called the step size parameter, x(n-k) is the sample of the input signal located at the kth tap of the filter at time n, and e(n).x(n-k) is an approximation (estimate) of the negative of the gradient for the kth filter coefficient. This is the LMS recursive algorithm for adjusting the filter coefficients adaptively so as to minimize the sum of squared errors ε.
The step size parameter Δ controls the rate of convergence of the algorithm to the optimum solution. A large value of Δ leads to a large step size adjustments and thus to rapid convergence, while a small value of Δ leads to slower convergence. However if Δ is made too large the algorithm becomes unstable. To ensure stability, Δ must be chosen to be in the range
0< Δ < 1/10NPx
Where N is length of adaptive FIR filter and Px is the power in the input signal, which can be approximated by
Px ≈ 1/(1+M)

Figure 6.1: LMS ALGORITHM FOR OEFICIENT ADJUSTMENT

6.3 ADAPTIVE FILTER FOR ESTIMATING AND SUPPRESSING AWGN INTERFERENCE

Let us assume that we have a signal sequence x(n) that consists of a desired signal sequence, say w(n), computed by an AWGN interference sequence s(n). The two sequences are uncorrelated.

The characteristics of interference allow us to estimate s(n) from past samples of the sequence x(n)=s(n)+w(n) and to subtract the estimate from x(n).

The general configuration of the interference suppression system is shown in the entire block diagram of the system. The signal x(n) is delayed by D samples, where delay is chosen sufficiently large so that the signal components w(n) and w(n-D), which are contained in x(n) and x(n-D) respectively, are uncorrelated. The out put of the adaptive FIR filter is the estimate

s(n) =

The error signal that is used in optimizing the FIR filter coefficients is e(n)=x(n)-s(n). The minimization of the sum of squared errors again leads to asset of linear equations for determining the optimum coefficients. Due to the delay D, the LMS algorithm for adjusting the coefficients recursively becomes,
hn(k)=hn-1(k)+ Δ.e(n).x(n-k-D), k=0,1,…..N-1

Chapter 7

DEMODULAITON

Function of receiver consists of two parts:

A. Demodulation

B. Detection

Demodulation is the act of extracting the original information-bearing signal from a modulated carrier wave. A demodulator is an electronic circuit used to recover the information content from the modulated carrier wave. Coherent Demodulation is accomplished by demodulating using a local oscillator (LO) which is at the same frequency and in phase with the original carrier. The simplest form of non-coherent demodulation is envelope detection. Envelope detection is a technique that does not require a coherent carrier reference and can be used if sufficient carrier power is transmitted.

Although the structure of a non-coherent receiver is simpler than is a coherent receiver, it is generally thought that the performance of coherent is superior to non-coherent in a typical additive white Gaussian noise environment. Demodulation entails separating the received signal into its constituent components. For a QPSK signal, these are cosine and sine waveforms carrying the bit information. Detection is the process of determining the sequence of ones and zeros those sinusoids represent.

7.1 DEMODULATION

The first step is to multiply the incoming signal by locally generated sinusoids. Since the incoming signal is a sum of sinusoids, and the receiver is a linear system, the processing of the signal can be treated individually for both components summed upon completion. Assuming the received signal is of the form

r(n)=Ai cos(ω0n)+Aq sin(ω0n)

where Ai and Aq are scaled versions of the bi and bq bit stream used to modulate the signal at the transmitter. Due to cos(ω0n) input alone,

rci(n)= Ai cos(ω0n) cos(ω0n+Ө)

and

rcq (n)= Ai cos(ω0n) sin(ω0n+Ө)

where Ө is the phase difference between incoming signal and locally generated sinusoids. Similarly for sin(ω0n) portion of the input r(n),

rsi(n)= Ai sin(ω0n) cos(ω0n+Ө)……….7.1

and

rsq(n)= Ai sin(ω0n) sin(ω0n+Ө)………..7.2

7.2 SYNCHRONIZATION

For the received data to be interpreted and detected correctly there needs to be coordination between the receiver and transmitter. Since they are not physically connected, the receiver has no means of knowing the state of the transmitter. This state includes both the phase argument of the modulator and the bit timing of the transmitted data sequence. The receiver must therefore extract the desired information from the received digital signal to achieve synchronization. A common means of accomplishing synchronization is with a PLL. A phase-locked loop or phase lock loop (PLL) is a control system that generates a signal that has a fixed relation to the phase of a “reference” signal. A phase-locked loop circuit responds to both the frequency and the phase of the input signals, automatically raising or lowering the frequency of a controlled oscillator until it is matched to the reference in both frequency and phase. PLL compares the frequencies of two signals and produces an error signal which is proportional to the difference between the input frequencies. The error signal is then low-pass filtered and used to drive a voltage-controlled oscillator (VCO) which creates an output frequency. The output frequency is fed through a frequency divider back to the input of the system, producing a negative feedback loop. If the output frequency drifts, the error signal will increase, driving the frequency in the opposite direction so as to reduce the error. Thus the output is locked to the frequency at the other input. This input is called the reference and is often derived from a crystal oscillator, which is very stable in frequency. At first the received signal is raised to 4th power. Then it is passed through a 4th order band pass filter and frequency divider. Thus the two sinusoid outputs used to demodulate the received signal are produced.

7.3 DETECTION

The signals [equation (7.1) and (7.2)] are passed through corresponding envelop detector and threshold comparator to obtain I data and Q data. An envelope detector is an electronic circuit that takes a high-frequency signal as input, and provides an output which is the “envelope” of the original signal. The capacitor in the circuit stores up charge on the rising edge, and releases it slowly through the resistor when the signal falls. The diode in series ensures current does not flow backward to the input to the circuit. Then threshold comparators compare the signals with their values and generate the I data and Q data. These are recombined by switching device to form received bit stream.

detection

Figure 7.1: DETECTION

7.4 AWGN Channel

During transmission, the signal undergoes various degrading and distortion effects as it passes through the medium from transmitter to receiver. This medium is commonly referred to as the channel. Channel effects include but are not limited to noise, interference, linear and non linear distortion and attenuation. These effects are contributed by a wide verity of sources including solar radiation, weather and signal from adjacent channels. But many of the prominent effects originate from the components in the receiver. While many of the effects can be greatly reduced by good system design, careful choice of filter parameters and coordination of frequency parameter usage with other users, noise and attenuation generally can not be avoided and are the largest contributors to signal distortion.

The most commonly used channel model to deal with noise is the additive white Gaussian noise (AWGN) channel model. The name results because the noise is simply added to the signal while the term white is used because the frequency content is equal across the entire spectrum. In reality this type of noise does not exists and is confined to a finite spectrum, but it is sufficiently useful for systems whose bandwidth are small compared to the noise power spectrum. When modeling a system across an AWGN channel, the noise must first be filtered to the channel prior to addition.

Chapter 8

RESULTS

8.1 SIMULATION

The section describes the performance of QPSK Modulation for speech.The simulation was done using MATLAB 7 platform.

All codes for this chapter are contained in Appendix A. An adaptive filter is used in these routines. All of the repeatedly used values such as cosine and sine are retrieved from look up tables to reduce computation load.

8.2 TRANSMITTER

A speech signal is transmitted through the entire system. In each case speech signals are obtained from the internet. These are short segments of speech data of 6-7 seconds. From the speech signal 30874 samples are taken.

These samples are then quantized. Here 4 bit PCM is used (as 8 bit or higher PCM takes longer time during the simulation) to obtain a total of 123496 bits from 30874 samples.

The bits are divided into even bits and odd bits using flip flop. Here for simplicity and for the purpose of better understanding only 8 bits are shown on the figure instead of 123496 bits. Consider that the bit sequence is 11000110.

The even bits (1010) are modulated using a carrier signal (sine wave) and odd bits (1001) are modulated using the same carrier signal with 90 degree phase shift (cosine wave). The modulation process is explained explicitly in the previous sections. In the case of odd data cosine wave represents 1 while cosine wave with 180 degree phase shift represents 0. On the other hand in the case of even data sine wave represents 1 and sine wave with 180 degree phase shift represents 0. The odd data and even data are modulated separately in this way and then added using a linear adder to obtain QPSK modulated signal. This signal is passed through a band pass filter and transmitted through the channel.

8.3 Channel and receiver

In this system AWGN channel is considered. As the signal passes through the channel it is corrupted by AWGN noise. AWGN command in MATLAB is used to generate this noise. Here SNR is taken sufficiently large to avoid possibility of bit errors. Bit error rate and the performance of the system depend highly on the SNR which is discussed later in this chapter. To remove this AWGN interference sequence from the received signal the signal is passed through an adaptive filter. The adaptive filter uses LMS algorithm which is explained explicitly in the previous sections. Then the desired signal is obtained.

This desired signal is then passed through the demodulation process. At first it is passed through a PLL to obtain necessary carrier signal. Here for simplicity the angle generated by PLL is considered zero. At one side this desired signal is demodulated with sine wave to obtain even data while on the other side it is demodulated by cosine wave to obtain odd data.

Then these signals are passed through corresponding envelop detector and threshold comparator to obtain odd data and even data. When data is greater than .75 then it detected as 1 on the other hand when data is less than .75 then it is detected as 0. After that a switching device is used to combine odd data and even data.

Then this bit stream is passed through the decoder and the received speech signal is obtained. This received signal can be heard using soundsc command

Here theoretical Eb/N0 vs. BER curve for QPSK is shown

CHAPTER-9

CONCLUSION

In this project the details of a digital communication system implementation using QPSK modulation and adaptive equalization have been discussed. Pulse-code modulation (PCM) is a digital representation of an analog signal where the magnitude of the signal is sampled regularly at uniform intervals, then quantized to a series of symbols in a numeric (usually binary) code. PCM can facilitate accurate reception even with severe noise or interference. An adaptive equalizer is an equalization filter that automatically adapts to time-varying properties of the communication channel. It is frequently used with coherent modulations. It is useful for estimating and suppressing AWGN interference. Lastly, QPSK is an efficient modulation scheme currently used by modem satellite communication links.
We studied QPSK modulation technique through out the project. Instead of using other modulation techniques such MSK, 8-QPSK, 16-QPSK etc we used 4-QPSK in this project. QPSK is a quaternary modulation method, while MSK is a binary modulation method. In QPSK, the I and Q components may change simultaneously, allowing transitions through the origin. In a hypothetical system with infinite bandwidth, these transitions occur instantaneously; however, in a practical band-limited system (in particular, a system using a Nyquist filter) these transitions take a finite amount of time. This results in a signal with a non-constant envelope. MSK performed in such a way that the transitions occur around the unit circle in the complex plane, resulting in a true constant-envelope signal. Using 8-QPSK and 16-QPSK techniques higher data rate and higher spectral efficiency can be achieved but BER also increases. The performance of MSK, 8-QPSK, 16-QPSK techniques is better but implementation of these techniques is complex. 4-QPSK is simpler and easy to implement. Its spectral efficiency is not higher than that of 8-QPSK, 16-QPSK but it provides lower BER. In this project we performed the simulation of 4-QPSK modulation technique using MATLAB platform accurately and without any error. The system is flexible enough in accommodating any speech signal or analog signal. Digital communication systems can be implemented using QPSK modulation.

read more
EEE

Performance analysis of IEEE 802.16d system using different modulation scheme under SUI channel with FEC

Introduction

In past years, we purely lived on analog system. Both the sources and transmission system were on analog format but the advancement of technology made it possible to transmit data digitally. Broadband Wireless Access (BWA) has emerged as a promising solution for last mile access technology to provide high speed internet access in the residential as well as small and medium sized enterprise sectors. Applications like voice, Internet access, instant messaging, SMS, paging, file transferring, video conferencing, gaming and entertainment etc became a part of life. We can consider cellular phone systems, WLAN, wide-area wireless data systems, ad-hoc wireless networks and satellite systems etc as wireless communication. Wireless technology  provide higher throughput, huge mobility, longer range, robust backbone to thereat. Engineers are trying to  provide smooth transmission of multimedia anywhere on the globe through variety of applications and devices leading a new concept of wireless communication which is less expensive  and flexible to implement even in odd environment.

Wireless Broadband Access (WBA) via DSL, T1-line or cable infrastructure is not available especially in rural or suburban areas. The DSL can covers only up to near about 18,000 feet (3 miles), this means that many urban, suburban, and rural areas may not served. The little-bit solution of this problem is to use Wi-Fi standard broadband connection but for coverage limitation its not possible in everywhere . But the Urban-area Wireless standard which is called WiMAX can solve these shortcoming. The wireless broadband connection is much easier to expose, have long range of coverage, easier to access and more  flexible.

This connectivity is really important for developing countries and IEEE 802.16 family helps to solve the last mile connectivity problems with BWA connectivity. IEEE 802.16e can operate in both Line-Of-Sight (LOS) and Non-Line-Of-Sight (NLOS) environments. In NLOS, the PHY specification is extended to 211 GHz frequency band which aim is to fight with fading and multipath propagation. The OFDM physical layer based IEEE 802.16 standard is almost identical to European Telecommunications Standard Institute’s (ETSI) High performance Metropolitan Area Network (HiperMAN) as they cooperate with each other[1] .

This thesis is all about WiMAX OFDM PHY layer performance where we analyzed the results using MATLAB simulator with different modulation techniques.

1.2 Why WiMAX

WiMAX is the next generation broadband wireless technology. It offers high speed, secure, sophisticate and last mile broadband services along with a cellular pull back and Wi-Fi hotspots. The evolution of WiMAX began shortly when scientists and engineers felt the importance  of having a wireless Internet access and other broadband services which works well in rural and urban areas and also in those areas where it is not possible to establish wired infrastructure. IEEE 802.16, also known as IEEE Wireless-MAN, explored both licensed and unlicensed band of 2-66 GHz which is standard of fixed wireless broadband and included mobile broadband application. WiMAX forum, a private organization was formed in June 2001 to coordinate the components and develop the equipment those will be compatible and inter operable. After several years, in 2007, Mobile WiMAX equipment developed with the standard IEEE 802.16e got the certification and they announced to release the product in 2008, providing mobility and nomadic access. The IEEE 802.16e air interface based on Orthogonal Frequency Division Multiple Access (OFDMA) which main aim is to give better performance in non-line-of-sight environments. IEEE 802.16e introduced scalable channel bandwidth up to 20 MHz, Multiple Input Multiple Output (MIMO) and AMC enabled 802.16e technology to support peak Downlink (DL) data rates up to 63 Mbps in a 20 MHz channel through Scalable OFDMA (S-OFDMA) system. IEEE 802.16e has strong security architecture as it uses Extensible Authentication Protocol (EAP) for mutual authentication, a series of strong encryption algorithms, CMAC or HMAC based message protection and reduced key lifetime.

1.3 Fixed Vs Mobile WiMAX

There are certain differences between Fixed WiMAX and Mobile WiMAX. 802.16d  is known as Fixed WiMAX and 802.16e standard is fondly referred as Mobile-WiMAX. The 802.16d standard supports fixed and nomadic applications whereas 802.16e standard supports fixed, nomadic, mobile and portable applications. The 802.16e carries all the features of 802.16d standard along with new specifications that enables full mobility at vehicular speed, better QoS performance and power control but 802.16e devices are not compatible with 802.16d base stations as 802.16e based on TDD whereas 802.16d is on FDD. Due to other compatibility issues with existing networks, 802.16e adopted S-OFDMA and 2048-FFT size. The main aim of mobile WiMAX is to support roaming capability and handover between Mobile Station (MS) and Base Station (BS) [2]. Several countries have already planned Mobile WiMAX for commercial services. The development included some new features on the link layer. Such features are, different types of handover techniques, robust power saving system and multiple broadcast supports etc.

1.4 WiMAX’s Path to Overcome

There are several challenges for WiMAX. These important issues must be solved to fulfill its dream of last mile solution. Some of those are mentioned below.

1.4.1 PAL and PAPR

OFDM has high Peak to Average Power Ratio. A recent analysis of its waveform showed a large fluctuation in its amplitude which leads to a huge challenge to design a power amplifier with adequate power back-off. To do so, it has to focus on different situations like, good sensitivity when the power is low, tolerability to high power level and tracking ability to track down changes. Clipping and coding have been used to fight with these effects but still researches needed in that issue to make it a good wireless communication system.

1.4.2 Attenuation

Each signal has a specific potency. To reach to a distant receiver, a signal must be strong enough to be detected by the receiver. When a signal travels in the air, gradually it becomes weaker over time and this phenomenon is called Attenuation. WiMAX is considering this issue carefully as it works on both LOS and NLOS environment.

1.4.3 Multi Path Fading

When an object comes on the way between a wireless transmitter and a receiver, it blocks the signal and creates several signal paths known as multi path. Even though the signal makes till the receiver but with variant time and it is hard to detect the actual signal. Multi path degrade the quality of the signal. Several multipath barriers which as follow:

  •  Fast Fading

Rapid changes in signal power occur when distance moves about a half wave length. It is build up by constructive and destructive Interference. This fading occurs when the coherence time is less than the each symbol period and the Doppler spread spectrum is high in the channel.

  • Slow Fading

Changes in average received signal power due to the changing distance between transmitter and the receiver or changes of surroundings when moving. This fading occurs when the coherence time is greater than the each symbol period and the Doppler spread spectrum is low in the channel.

  • Flat Fading (Non-Selective Fading)

Flat fading is that type of fading in which all frequency components of the received signal fluctuates simultaneously in the same proportion[3].This fading occurs when the channel bandwidth and delay spread spectrum of a signal is less than the channel bandwidth and symbol period.

  • Frequency Selective Fading

Selective fading affects unequally the different spectral components of a radio signal[3]. This fading occurs when the channel bandwidth and delay spread spectrum of a signal is greater than the channel bandwidth and symbol period.

  • Rayleigh Fading

NLOS (indoor, city) Rayleigh fading occurs when there is no multipath LOS between transmitter and receiver and have only indirect path which is called NLOS to receive the resultant waves[3].


  • Rician Fading

Rician fading best characterizes a situation where there is a direct LOS path in addition to a number of indirect multipath signals between the transmitter and receiver.

1.4.4 Noise

Different types of noises create problem in wireless communication which hampers the transmission quality. Best known noises in wireless media are:

  • Thermal Noise

It occurs due to agitation of electrons and it is present in all electronic devices and transmission media such as transmitter, channels, repeaters and receiver. It is more significant in satellite communication[4].

Principle equation:

N0 = KT (W/Hz) ——————————————————————————— (1.1)

Where: N0= noise power density in watts per 1 Hz of bandwidth K = Boltzmann’s constant = 1.3803 ´10-23J/K T = temperature, in Kelvin (absolute temperature)

If the noise is assumed as independent, the thermal noise present in a bandwidth of B Hertz (in watts):

N= KTB ———————————–                  ———————————————- (1.2)

Or, in decibel-watts,

N=10 log k+ 10log T +10log B  = -228.6 dbW+10log T +10log B ——————(1.3)

  •  Inter-modulation noise

It occurs if the medium has non-linearity. Interference caused by signals produced at frequencies that are the sum or variety of original frequencies.

  • Inter Symbol Interference (ISI)

At the same time all delayed copies in a pulse may arrive as primary pulse for a subsequent bit.

  • Cross Talk

If there are unwanted coupling found in a signal path, it is called cross talk. It creates so many problems in communication media.

  • Impulse Noise

 When irregular pulses or noise spikes occurs due to external electromagnetic disturbances, or faults and flaws in the communications system that is called impulse noise. The behavior of this type of noise has short duration and relatively high amplitude.

  • Doppler Shift Effect

Doppler shift occurs when a mobile user move towards or away from the transmitter. It has huge impact on carrier frequency causing the communication poor in performance and increasing error probability.

Chapter-2

Wi-Max Architecture

2.1 Evolution of IEEE family of standard for BWA:

The IEEE standard committee introduced standards for networking elements, for an instance, IEEE 802.16 in 1999. The 802.16 family standard is introduced as Wireless Metropolitan Area Network (MAN) commercially known as WiMAX (Worldwide interoperability for Microwave Access) which is an nonprofit, industry-led organization and responsible for certificating, testing, and promoting the compatible interoperable wireless products based on IEEE 802.16 working group and ETSI’s HiperMAN standard. The original IEEE standard addressed 10 to 66 GHz in licensed bands and 2 to 11 GHz in unlicensed frequency range. They certified different versions of WiMAX based on different criteria such as carrier based wireless (single and multi carrier), fixed and portable wireless devices etc.

2.2 IEEE 802.16 versions

 2.2.1 802.16

The first 802.16 standard was released in December 2000. It provides a standard point-to-multipoint broadcast in 10 to 66 GHz frequency range for Line of Sight (LOS) environment.

2.2.2 802.16a

The second version of WiMAX standard 802.16a was an amendment of 802.16 standard and has the capability to broadcast point-to-multipoint in the frequency range 2 to 11 GHz. It was established in January 2003 and assigned both licensed and unlicensed frequency bands. Unlicensed bands cover maximum distance from 31 to 50 miles. It improves the Quality of Service (QoS) features with supporting protocols for instance Ethernet, ATM or IP.

2.2.3 802.16c

The third version of WiMAX standard 802.16c was also an amendment of 802.16 standards which mostly dealt with frequency ranging 10 to 66 GHz. This standard addressed various issues, for instance, performance evaluation, testing and detailed system profiling. The system profile is developed to specify the mandatory features to ensure interoperability and the optional features that differentiate products by pricing and functionality.

 2.2.4 802.16d

In September 2003, a revision project known as 802.16d began which aimed to align with a particular view of European Telecommunications Standards Institute (ETSI) Hiper-MAN. This project was deduced in 2004 with the release of 802.16d-2004 including all previous Performance Evaluation of IEEE 802.16e (Mobile WiMAX) in OFDM Physical versions’ amendments. This standard supports mandatory and optional elements along with TDD and FDD technologies. Theoretically, its effective data rate is 70 Mbps but in reality, the performance is near about 40 Mbps. This standard improves the Quality of Service (QoS) by supporting very large Service Data Units (SDU) and multiple polling schemes.

2.2.5  802.16e

802.16e was an amendment of 802.16d standard which finished in 2005 and known as 802.16e-2005. Its main aim is mobility including large range of coverage. Sometimes it is called mobile WiMAX. This standard is a technical updates of fixed WiMAX which has robust support of mobile broadband. Mobile WiMAX was built on Orthogonal Frequency Division Multiple Access (OFDMA). It mentioned that, both standards (802.16d-2004 and 802.16e-2005) support the 256-FFT size. The OFDMA system divides signals into sub-channels to enlarge resistance to multipath interference. For instance, if a 30 MHz channel is divided into 1000 sub-channels, each user would concede some sub-channels which are based on distance.

Table 2.1: Comparison of IEEE standard for BWA

IEEE 802.16

IEEE 802.16a

IEEE802.16

IEEE 802.16e

Completed

December 2001

January 2003

June 2004

December 2005

Spectrum

10-66

GHz

2-11

GHz

2-11

GHz

2-6

GHz

Popagation/channel

conditions

LOS

NLOS

NLOS

NLOS

Bit Rate

Up to 134 Mbps

(28 MHz

channelization)

Up to 75 Mbps

(20 MHz

channelization)

Up to 75 Mbps

(20 MHz

channelization)

Up to 15Mbps (5

MHz

channelization)

Modulation

QPSK, 16-QAM

(optional in UL),

64-QAM

(optional)

BPSK, QPSK,

16-QAM,

64-QAM,

256-QAM

(optional)

256 subcarriers

OFDM, BPSK,

QPSK, 16-QAM,

64-QAM,

256-QAM

Scalable

OFDMA, QPSK,

16-QAM,

64-QAM,

256-QAM

(optional)

Mobility

Fixed

Fixed

Fixed

Fixed

 2.3 Features of WiMAX

There are certain features of WiMAX those are making it popular day by day. Some important features of WiMAX are described below:

 2.3.1 Interoperability

This is the main concern of WiMAX. The IEEE 802.16 standard is internationally accepted and the standard is maintained and certified by WiMAX forum which covers fixed, portable and mobile deployments and giving the user the freedom to choose their product from different certified vendors and use it in different fixed, portable or mobile networks.

2.3.2 Long Range

Another main feature of WiMAX is long range of coverage. Theoretically, it covers up to 30 miles but in practice, it covers only 6 miles. The earlier versions of WiMAX provide LOS coverage but as technology advanced and the later version of WiMAX, e.g. mobile WiMAX, can support both LOS and NLOS connections. For that, it must meet the condition of the range for LOS, 50 kilometers and for NLOS, 10 kilometers. The WiMAX subscriber may connect to WiMAX Base station by Stanford University Interim (SUI) traffic model from their offices, homes, hotels and so on.

2.3.3 Mobility

WiMAX offers immense mobility especially IEEE 802.16e-2005 as it adopted SOFDMA (Scalable Orthogonal Frequency Division Multiple Access) as a modulation technique and MIMO (Multiple Input Multiple Output) in its physical layer. There are two challenges in wireless connectivity, one of them is for session initiation, which provides a mean to reach to inactive users and continue the connection service by extending it even the home location of that user has been changed and the other one provides an ongoing session without interruption while on moving (specially at vehicular speed). The first is known as roaming and the second one is handoff. These two are described below.

  • Roaming

The centralized database keeps current information which sends to the network by the user base station when it moves from one location to another. To reach another subscriber station the network pages for it using another base station. The used subscriber station for paging depends on updating rate and movement of subscriber station – that means from one station to another. To perform this operation, there are several networking entities involved such as NSS (Network Switching Subsystem), HLR (Home Location Register) and VLR (Visitor Location Register) etc.

  • NSS (localization and updating of location)
  • HLR (contains information of current location) and
  • VLR (sends information to Mobile Station to inform HLR about the changes of location)
  • Handoff

Due to the absence of handoff technique, the Wi-Fi users may move around a building or a hotspot and be connected but if the users leave their location, they lose their connectivity. But with the 802.16e-2005, the mobile users will be connected through Wi-Fi when they are within a hotspot and then will be connected to 802.16 if they leave the hotspot but will stay in the WiMAX coverage area.

2.3.4 Quality of Service

Quality of Service (QoS) refers to the collective effect of service perceived by the users. Actually it refers to some particular requirements such as throughput, packet error rate, delay, and jitters etc. The wireless network must support a variety of applications for instance, voice, data, video, and multimedia. Each of these has different traffic pattern and requirements which is shown in the Table 2.2 [3].

Table 2.2: Sample Traffic Parameters for Broadband Wireless Application [3]

Parameter Interactive Gaming Voice Streaming Media Data Video
Data rate 50Kbps to 85Kbps 4Kbps-64Kbps 5Kbps-384Kbps 0.01Mbps-100Mbps > 1Mbps
Applications Interactive gaming VoIP Music, Speech, Video Clips Web browsing, e-mail, instant messaging, telnet, file download IPTV, movie download, p2p video sharing
Packet loss Zero <1% <1% Audio <2% Video Zero <10-8
Delay Variation Not Applicable <20ms <2sec Not Applicable <2sec
Delay <50ms-150ms <100ms <250ms Flexible <100ms

   2.3.5 Interfacing

Interface installation is another feature of WiMAX. Each base station broadcasts radio signals to its subscribers to stay with connection. Since each base station covers limited range so it is necessary to install multiple base stations after a certain distance to increase the range for network connectivity. Connecting multiple base stations is not a big deal and it takes only a few hours.

2.3.6 Accessibility

To get high speed network connectivity, only necessary thing is to become a subscriber of WiMAX service providers. Then they will provide hardware that is very easy to install. Most of time hardware connects through USB ports or Ethernet and the connection may be made by clicking button.

2.3.7 Scalability

802.16 standard supports flexible channel bandwidths for summarize cell planning in both licensed and unlicensed spectrum. If an operator assigned 15 MHz of spectrum, it can be divided into three sectors of 5MHz each. By increasing sector, the operator can increase the number of subscriber to provide better coverage and throughput. For an instance, 50 of hotspot subscribers are trying to get the network connectivity in a conference for 3 days. They also require internet access connectivity to their corporate network via Virtual Private Network (VPN) with T1 connection. For this connectivity, bandwidth is a big question as it needs more bandwidth. But in wireless broadband access it’s feasible to provide service to that location for a small period of time. It would be very hard to provide through wired connection. Even the operator may re-use the spectrum in three or more sectors by creating appropriate isolation.

2.3.8 Portability

Portability is another feature as like mobility that is offered by WiMAX. It is not only offers mobility applications but also offers nomadic access applications.

2.3.9 Last Mile Connectivity

Wireless network accesses via DSL, T1-line or cable infrastructure are not available especially in rural areas. These connections have more limitations which can be solved by WiMAX standards.

2.3.10 Robust Security

WiMAX have a robust privacy and key management protocol as it uses Advanced Encryption Standard (AES) which provides robust encryption policy. It also supports flexible authentication architecture which is based on Extensible Authentication Protocol (EAP) which allows variety of subscriber credentials including subscriber’s username and password, digital certificates and cards.

2.4 WiMAX Architecture

WiMAX architecture comprises of several components but the basic two components are BS and SS. Other components are MS, ASN, CSN and CSN-GW etc. The WiMAX Forum’s Network Working Group (NWG) has developed a network reference model according to the IEEE 802.16e-2005 air interface to make sure the objectives of WiMAX are achieved. To support fixed, nomadic and mobile WiMAX network, the network reference model can be logically divided into three parts[5].

  •  Mobile Station (MS)

It is for the end user to access the mobile network. It is a portable station able to move to wide areas and perform data and voice communication. It has all the necessary user equipments such as an antenna, amplifier, transmitter, receiver and software needed to perform the wireless communication. GSM, FDMA, TDMA, CDMA and W-CDMA devices etc are the examples of Mobile station.

  •  Access Service Network (ASN)

It is owned by NAP, formed with one or several base stations and ASN gateways (ASN-GW) which creates radio access network. It provides all the access services with full mobility and efficient scalability. Its ASN-GW controls the access in the network and coordinates between data and networking elements.

  •  Connectivity Service Network (CSN):

Provides IP connectivity to the Internet or other public or corporate networks. It also applies per user policy management, address management, location management between ASN, ensures QoS, roaming and security.

WiMAX Network Architecture based on IP

Fig 2.1: WiMAX Network Architecture based on IP

2.5 Mechanism

WiMAX is capable of working in different frequency ranges but according to the IEEE 802.16, the frequency band is 10 GHz – 66 GHz. A typical architecture of WiMAX includes a base station built on top of a high rise building and communicates on point to multi-point basis with subscriber stations which can be a business organization or a home. The base station is connected through Customer Premise Equipment (CPE) with the customer. This connection could be a Line-of-Sight (LOS) or Non-Line-of-Sight (NLOS).

2.5.1 Line of Sight (LOS)

In LOS connection, signal travels in a straight line which is free of obstacles, means, a direct connection between a transmitter and a receiver. The features of LOS connections are,

  •  Uses higher frequency between 10 GHz to 66 GHz
  • Huge coverage areas
  • Higher throughput
  • Less interference
  • Threat only comes from atmosphere and the characteristic of the frequency
  • LOS requires most of  its first Fresnel zone should be free of obstacles

WiMAX in LOS Condition

Fig 2.2: WiMAX in LOS Condition

 2.5.2 Non-Line of Sight (NLOS)

In NLOS connection, signal experiences obstacles in its path and reaches to the receiver through several reflections, refractions, diffractions, absorptions and scattering etc. These signals arrive to the receiver in different times, attenuation and strength which make it hard to detect the actual signal[6]. WiMAX offers other benefits which works well in NLOS condition,

  •  Frequency selective fading can be overcome by applying adaptive equalization
  • Adaptive Modulation and Coding (AMC), AAS and MIMO techniques helps WiMAX to works efficiently in NLOS condition
  • Sub-channelization permits to transmit appropriate power on sub-channels
  • Based on the required data rate and channel condition, AMC provides the accurate modulation and code dynamically

WiMAX in NLOS Condition

2.6 Major shortcomings of WiMAX

There are several major shortcomings of WiMAX which are still a headache to the engineers. Those are as follows:

  • Bit Error Rate

General concept of WiMAX is that, it provides high speed data rate within its maximum range (30 miles). If WiMAX operates the radio signals to its maximum range then the Bit Error Rate (BER) increases. So, it is better to use lower bit rates within short range to get higher data rates.

  • Data Rates

Mobile WiMAX uses Customer Premises Equipment (CPE) which is attached to computers (either desktop or laptop or PDA) and a lower gain Omni-directional antenna is installed which is difficult to use compared to fixed WiMAX.


  • LOS and NLOS coverage

Mobile WiMAX covers 10 kilometers with 10 Mbps speeds in line -of-sight (LOS) environment but in urban areas, it is only 2 kilometers coverage due to non-line-of-sight problem. In this situation, mobile WiMAX may use higher gain directional antenna for excellent coverage and throughput but problem is that it loose its mobility.

Besides all above shortcomings, there is a major impact of weather conditions like rain, fog and droughts etc on WiMAX networks.

2.7  IEEE 802.16 Protocol Layers

IEEE 802.16 standard WiMAX gives freedom in several things compared to other technologies. The focus is not only on transmitting tens of megabits of data to many miles distances but also maintaining effective QoS (Quality of Services) and security. This chapter gives an overview of IEEE 802.16 protocol layers and OFDM features. WiMAX 802.16 is mainly based on the physical and data link layer in OSI reference model. Here, Physical layer can be single-carrier or multi-carrier (PHY) based and its data link layer is subdivided into two layers

  • Logical Link Control (LLC) and
  • Medium Access Control (MAC)

MAC is further divided into three sub-layers:

  • Convergence Sub-layer (CS)
  • Common Part Sub-layer (CPS) and
  • Security Sub-layer (SS).

 2.7.1 Physical Layer (PHY)

Physical layer set up the connection between the communicating devices and is responsible for transmitting the bit sequence. It also defines the type of modulation and demodulation as well as transmission power. WiMAX 802.16 physical layer considers two types of transmission techniques OFDM and OFDMA. Both of these techniques have frequency band below 11 GHz and use TDD and FDD as its duplexing technology. After implementing OFDM in IEEE 802.16d, OFDMA has been included in IEEE 802.16e to provide support in NLOS conditions and mobility. The earlier version uses 10 to 66 GHz but the later version is expanded to use up the lower bandwidth from 2 to 11 GHz which also supports the 10 to 66 GHz frequency bands. There are some mandatory and some optional features included with the physical layer specification.

WiMAX Physical and MAC layer architecture

Fig 2.4: WiMAX Physical and MAC layer architecture

 From OSI 7 layer reference model, WiMAX only uses the physical layer and MAC of datalink layer.

There are specific names for each physical layer interface. The Table summarizes IEEE 802.16 physical layer’s features.

Table 2.3: IEEE 802.16 standard air interface’s description

Specific Name   Operating Band   Duplexing  
Noticeable Feature
WirelessMAN-SC™  10 to 66 GHz  FDD and TDD  Single-carrier 
WirelessMAN-SCa™  2 to 11 GHz, Licensed  FDD and TDD  Single-carrier, NLOS 
WirelessMAN-OFDMA™  2 to 11 GHz, Licensed  FDD and TDD  OFDM technique, NLOS 
WirelessHUMAN™  2 to 11 GHz, Free  TDD  Single-carrier, LOS, NLOS, OFDM, OFDMA, Frequency selective channel 
WirelessMAN-OFDMA™  2 to 11 GHz, Licensed  FDD and TDD  Single frequency band, OFDM system divides signal into sub-channels 

 2.7.2 MAC layer

The basic task of WiMAX MAC is to provide an interface between the physical layer and the upper transport layer. It takes a special packet called MAC Service Data Units (MSDUs) from the upper layer and makes those suitable to transmit over the air. For receiving purpose, the mechanism of MAC is just the reverse. In both fixed and mobile WiMAX, it included a convergence sub-layer which is able to interface with upper layer protocols such as ATM, TDM, Voice and other advanced protocols. WiMAX MAC has unique features to identify and address the SS and BS. Each SS carries 48-bit IEEE MAC address whereas BS carries 48-bit Base Station ID in which 24-bit uses for operator indicator. Other features are, 16-bit CID, 16-bit SAID and 32-bit SFID. MAC supports a variety of applications and mobility features such as,

  •  PKM for MAC security and PKMV2 for Extensible Authentication Protocol (EAP)
  • Fast handover and strong mobility management
  • Provides normal, sleep and idle mode power levels

 2.7.3 Sub-layers

WiMAX MAC layer is divided into three sub-layers such as Service Specific Convergence Sub-layer (SSCS), Common Part Sub-layer (CPS) and Security Sub-layer (SS).

Purposes of MAC Layer in WiMAX

Fig 2.5: Purposes of MAC Layer in WiMAX

2.7.4 Service Specific Convergence Sub-layer (SSCS)

This stays on the top of MAC layer architecture which takes data from the upper layer entities such as router and bridges. It is a sub-layer that is service dependent and assures data transmission. It enables QoS and bandwidth allocation. Payload header suppression and increase the link efficiency are other important task of this layer. IEEE 802.16 specifies two types of SSCS for mapping function.

  • ATM Convergence sub-layer: is a logical interface which is responsible for Asynchronous Transfer Mode (ATM) services. In the operation, it accepts ATM cells from ATM layer classify and then sends CS PDUs to MAC SAP. It differentiates Virtual path switched ATM connection and assigns Channel ID (CID)
  • Packet Convergence sub-layer: It’s a packet based protocol which performs packet mapping such as IP, IPv4, IPv6, IEEE 802.3 Ethernet LAN, VLAN and PPP.

2.7.5 Common Part Sub-layer (CPS)

It stays underneath of SSCS and above the Security Sub-layer and defines the multiple access mechanism. CPS is responsible for the major MAC functionalities like system access, establishing the connection and maintain and bandwidth management etc. As WiMAX MAC is connection oriented so it provides service flows after each Subscriber Station’s registration. Other responsibilities are, providing QoS for service flows and managing connection by adding or deleting or modifying the connection statically or dynamically. On downlink channel, only the BS transmits and it does not need any coordination function. SS receives only those messages which are addressed to them. On uplink channel, three major principles defines the transmission right[7],

  • Unsolicited bandwidth permission
  • Polling and
  • Contention procedures

2.7.6 Security Sub-layer (SS)

 This part stays at the bottom of MAC layer and one of the most important part of MAC as it provides authentication, secure key exchange, encryption and integrity of the system. IEEE 802.16 standard defines both ways data encryption connection between subscriber and base station. A set of cryptographic suites such as data encryption and authentication algorithm has been defined which made security sub-layer of WiMAX MAC very robust. A secure distribution of keying data from base station to subscriber station is assured by providing an authentication and a PKM protocol. On top of that, in SS, the addition of a digital certificate strengthen the privacy of data and in BS, the PKM assured the conditional access to the network services and applications. Further improvement of PKM protocol is also defined with some additional features and with a new name named PKMv2 which strongly controls integrity, mutual authentication and handover mechanisms[8].

2.8 WiMAX forum and adaptation of IEEE 802.16

The Worldwide Interoperability for Microwave Access (WiMAX) forum is an alliance of telecommunication equipments and components manufacturers and service providers, formed to promote and certify the compatibility and interoperability of BWA products employing the IEEE 802.16 and ETSI HiperMAN[9]  wireless specifications. WiMAX Forum Certified™[10] equipment is proven interoperable with other vendors’ equipment that is also WiMAX Forum Certified™. So far WiMAX forum has setup certification laboratories in Spain, Korea and China. Additionally, the WiMAX forum creates what it calls system profiles, which are specific implementations, selections of options within the standard, to suit particular ensembles of service offerings and subscriber populations[11].   WiMAX forum has adopted two version of the IEEE 802.16 standard to provide different types of access:

  • Fixed/Nomadic access: The WiMAX forum has adopted IEEE802.162004 And ETSI HyperMAN standard for fixed and nomadic access[9]. This uses Orthogonal Frequency Division Multiplexing and able to provide supports in Line of Sight (LOS) and Non Line of Sight (NLOS) propagation environment. Both outdoor and indoor CPEs are available for fixed access. The main focus of the WiMAX forum profiles are on 3.5 GHz and 5.8 GHz frequency band.
  • Portable/Mobile Access: The forum has adopted the IEEE 802.16e version of the standard, which has been optimized for mobile radio channels. This uses Scalable OFDM Access and provides support for handoffs and roaming[9]. IEEE 802.16e based network is also capable to provide fixed access. The WiMAX Mobile WiMAX profiles will cover 5, 7, 8.75, and 10 MHz channel bandwidths for licensed worldwide spectrum allocations in the 2.3 GHz, 2.5 GHz, 3.3 GHz and 3.5 GHz frequency bands[12]. The first certified product is expected to be available by the end of 2007.

2.9 Application of IEEE 802.16 based network:

IEEE 802.16 supports ATM, IPv4, IPv6, Ethernet and Virtual Local Area Network (VLAN) services [13]. SO, it can provide a rich choice of service possibilities to voice and data network service providers. It can be used for a wide selection of wireless broadband connection and solutions.


  • Cellular Backhaul: IEEE 802.16 wireless technology can be an excellent choice for back haul for commercial enterprises such as hotspots as well as point to point back haul applications due to its robust bandwidth and long range.
  • Residential Broadband: Practical limitations like long distance and lack off return channel prohibit many potential broadband customers reaching DSL and cable technologies [14]. IEEE 802.16 can fill the gaps in cable and DSL coverage.
  • Underserved areas: In many rural areas, especially in developing countries, there is no existence of wired infrastructure. IEEE 802.16 can be a better solution to provide communication services to those areas using fixed CPE and high gained antenna.
  •  Always Best Connected: As IEEE 802.16e supports mobility [15], so the mobile user in the business areas can access high speed services through their IEEE 802.16/WiMAX enabled handheld devices like PDA, Pocket PC and smart phone.

Application scenarios

Figure 2.6: Application scenarios

 Chapter-3

Modulation

3.1 Modulation Techniques

The variation of the property of a signal, such as its amplitude, frequency or phase is called modulation. This process carries a digital signal or message. Different types of modulation techniques are available such as, Amplitude Shift Keying (ASK), Frequency Shift Keying (FSK) and Phase Shift Keying (PSK). This section discusses on different modulation techniques along with WiMAX’s special modulation technique which is called Adaptive Modulation technique.

3.2 ASK, FSK and PSK

Basic modulation techniques consist on three parts. Which as follows,

  • Amplitude Shift Keying (ASK)
  • Frequency Shift Keying (FSK)
  • Phase Shift Keying (PSK)

3.2.1 Amplitude-Shift Keying (ASK)

Amplitude difference of carrier frequency is called ASK. In this, the phase and the frequency are always constant. The principle is based on the mathematical equation,

1

Features of ASK

  • Likely to be affected by sudden changes of gain.
  • Inefficient modulation technique compared to other techniques.
  • On the voice transmission lines such as telephone, used up to 1200 bps.
  • Use in optical fibres to transmit digital data.

3.2.2 Frequency Shift Keying (FSK)

Frequency difference near carrier frequency is called FSK. In this, the phase and the amplitude are always constant. There are several types of FSK. Most common are, Binary Frequency Shift Keying (BFSK) and Multiple Frequency Shift Keying (MFSK).

3.2.3 Binary Frequency Shift Keying (BFSK)

Two frequencies represent two binary values in this technique. The principle lies on the equation,

2

Features of BFSK

·         Less affected by errors than ASK.

·         On voice transmission lines such as telephone, range till 1200bps.

·         Which is used for high-frequency (3 to 30 MHz) radio frequency.

·         Suitable for LANs that use coaxial cables.

 3.2.4 Multiple Frequency Shift Keying (MFSK)

More than two frequencies are used to represent signaling elements. The principle lies on the equations,

 3

Features of MFSK

·         Multiple frequencies are used

·         More bandwidth efficient but very much affected by errors

·         Bandwidth requirement is 2Mfd in total.

·         Each signal element encodes L bits (M=2L).

3.2.5 Phase-Shift Keying (PSK)

Phase of carrier signal is digital modulation scheme which conveys data by modulating or changing of carrier wave. The most common and widely used are Binary Phase shift Keying (BPSK) and Quadrature Phase Shift Keying (QPSK). Other PSKs are Differential Phase Shift Keying (DPSK) and Multilevel Phase Shift Keying (MPSK) etc. As WiMAX uses Adaptive Modulation Techniques, so, here we will broadly discuss only BPSK, QPSK and QAM.

3.2.6 Binary Phase Shift Keying (BPSK)

This is also known as two-level PSK as it uses two phases separated by 180º to represent binary digits. The principle equation is,

4

This kind of phase modulation is very effective and robust against noises especially in low data rate applications as it can modulate only 1bit per symbol.

Block Diagram

Fig 3.1: BPSK, (a) Block Diagram (b) Constellation

3.2.7 Quadrature Phase Shift Keying (QPSK)

This is also known as four-level PSK where each element represents more than one bit. Each symbol contains two bits and it uses the phase shift of π/2, means 90º instead of shifting the phase 180º. The principle equation of the technique is:

5

In this mechanism, the constellation consists of four points but the decision is always made in two bits. This mechanism can ensure the efficient use of bandwidth and higher spectral efficiency[16].

Constellation

Fig 3.2: QPSK, (a) Block Diagram (b) Constellation

3.2.8 Quadrature Amplitude Modulation (QAM)

This is the most popular modulation technique used in various wireless standards. It combined with ASK and PSK which has two different signals sent concurrently on the same carrier frequency but one should be shifted by 90º with respect to the other signal. At the receiver end, the signals are demodulated and the results are combined to get the transmitted binary input [16]. The principle equation is: 

6

QAM Modulator Diagram

Fig 3.3: QAM Modulator Diagram

3.2.9 16-QAM

This is called 16-states Quadrature Amplitude Modulation which means four different amplitude levels would be used and the combined stream would be one of 16 = 4 * 4 states. In this mechanism, each symbol represents 4 bits[16].

QAM Constellation

Fig 3.4: 16-QAM Constellation

3.2.10 64-QAM

This is same as 16-QAM except it has 64-states where each symbol represents six bits (26= 64). It is a complex modulation techniques but with greater efficiency [16]. The total bandwidth increases according to the increasing number of states for each symbol. Mobile WiMAX uses this higher modulation technique when the link condition is high.

64-QAM Constellation

Fig 3.5: 64-QAM Constellation

3.3 Adaptive Modulation and Coding

The specified modulation scheme in the DL (DownLink) and UL( UpLink) are BPSK (Binary Phase Shift Keying) ,QPSK(Quadrature PSK), 16-QAM (16- Quadrature Amplitude Modulation) and 64-QAM to modulate bits to the complex constellation points. The FEC options are paired with the modulation schemes to form burst profiles. The PHY specifies seven combinations of modulation and coding rate, which can be allocated selectively to each subscriber, in both UL and DL [17]. There are tradeoffs between data rate and robustness, depending on the propagation conditions. Table 3.1 shows the combination of those modulation and coding rate.

Table 3.1: Mandatory channel coding per modulation

Modulation

Uncoded

Block Size

(bytes)

Coded

Block Size

(bytes)

Overall

coding rate

RS code

CC code

rate

BPSK

12

24

1/2

(12,12,0)

1/2

QPSK

24

48

1/2

(32,24,4)

2/3

QPSK

36

48

3/4

(40,36,2)

5/6

16-QAM

48

96

1/2

(64,48,8)

2/3

16-QAM

72

96

3/4

(80,72,4)

5/6

64-QAM

96

144

2/3

(108,96,6)

3/4

64-QAM

108

144

3/4

(120,108,6)

5/6


Chapter-4

Orthogonal Frequency Division Multiplexing

4.1 OFDM  BASIC:

The idea of OFDM comes from Multi Carrier Modulation (MCM) transmission technique. The principle of MCM describes the division of input bit stream into several parallel bit streams and then they are used to modulate several sub carriers as shown in Figure 4.1. Each subcarrier is separated by a guard band to ensure that they do not overlap with each other. In the receiver side, bandpass filters are used to separate the spectrum of individual subcarriers. OFDM is a special form of spectrally efficient MCM technique, which employs densely spaced orthogonal subcarriers and overlapping spectrums. The use of bandpass filters are not required in OFDM because of the orthogonality nature of the subcarriers. Hence, the available bandwidth is used very efficiently without causing the InterCarrier Interference (ICI). In figure 4.2, the effect of this is seen as the required bandwidth is greatly reduced by removing guard band and allowing subcarrier to overlap. It is still possible to recover the individual subcarrier despite their overlapping spectrum provided that the orthogonality is maintained. The Orthogonality is achieved by performing Fast Fourier Transform (FFT) on the input stream. Because of the combination of multiple low data rate subcarriers, OFDM provides a composite high data rate with long symbol duration. Depending on the channel coherence time, this reduces or completely eliminates the risk of InterSymbol Interference (ISI), which is a common phenomenon in multipath channel environment with short symbol duration. The use of Cyclic Prefix (CP) in OFDM symbol can reduce the effect of ISI even more[18], but it also introduces a loss in SNR and data rate.

Block diagram of a generic MCM transmitter

Figure 4.1: Block diagram of a generic MCM transmitter.

Comparison between conventional FDM and OFDM

Figure 4.2: Comparison between conventional FDM and OFDM

4.2 OFDM  SYSTEM  IMPLEMENTATION

The principle of OFDM was already around in the 50’s and 60’s as an efficient MCM technique. But, the system implementation was delayed due to technological difficulties like digital implementation of FFT/IFFT, which were not possible to solve on that time. In 1965, Cooley and Tukey presented the algorithm for FFT calculation[19] and later its efficient implementation on chip makes the OFDM into application.

The digital implementation of OFDM system is achieved through the mathematical operations called Discrete Fourier Transform (DFT) and its counterpart Inverse Discrete Fourier Transform (IDFT). These two operations are extensively used for transforming data between the time domain and frequency domain. In case of OFDM, these transforms can be seen as mapping data onto orthogonal subcarriers.

In order to perform frequency domain data into time domain data, IDFT correlates the frequency domain input data with its orthogonal basis functions, which are sinusoids at certain frequencies. In other ways, this correlation is equivalent to mapping the input data onto the sinusoidal basis functions. In practice, OFDM systems employ combination of fast fourier transform (FFT) and Inverse fast Fourier transform (IFFT) blocks which are mathematical equivalent version of the DFT and IDFT.

At the transmitter side, an OFDM system treats the source symbols as though they are in the frequency domain. These symbols are feed to an IFFT block which brings the signal into the time domain. If the N numbers of subcarriers are chosen for the system, the basis functions for the IFFT are N orthogonal sinusoids of distinct frequency and IFFT receive N symbols at a time. Each of N complex valued input symbols determines both the amplitude and phase of the sinusoid for that subcarrier. The output of the IFFT is the summation of all N sinusoids and makes up a single OFDM symbol. The length of the OFDM symbol is NT where T is the IFFT input symbol period. In this way, IFFT block provides a simple way to modulate data onto N orthogonal subcarriers.

Basic OFDM transmitter and receiver

Figure 4.3: Basic OFDM transmitter and receiver

At the receiver side, The FFT block performs the reverse process on the received signal and bring it back to frequency domain. The block diagram in Figure 4.3 depicts the switch between frequency domain and time domain in an OFDM system.


4.3 Data transmission

Data transmission is high enough compared to FDM as OFDM follows multicarrier modulation. For this, OFDM splits high data bits into low data bits and sends each sub-stream in several parallel sub-channels, known as OFDM subcarriers. These subcarriers are orthogonal to each other and the each subcarrier bandwidth is much lesser than the total bandwidth. Inter Symbol Interference is reduced in OFDM technique as the symbol time Ts of each sub-channel is higher than the channel delay spread

Time and Frequency diagram of Single and Multi-carrier signals

Fig 4.4: Time and Frequency diagram of Single and Multi-carrier signals                                

In the figure 4.4, it is clear that OFDM resists the multipath effect by adopting smaller frequency bandwidth and longer period of time which leads to get better spectral efficiency.

4.4 Parameters

The implementation of OFDM physical layer is different for two types of WiMAX. For fixed WiMAX, FFT size is fixed for OFDM-PHY and it is 256 but for mobile WiMAX, the FFT size for OFDMA-PHY can be 128, 512, 1024 and 2048 bits[1]. This helps to combat ISI and Doppler spread. Other difference between OFDM-PHY and OFDMA-PHY is, OFDM splits a single high bit rate data into several low bit rate of data sub-stream in parallel which are modulated by using IFFT whereas OFDMA accepts several users’ data and multiplex those onto downlink sub-channel. Uplink multiple access is provided through uplink sub-channel. OFDM-PHY and OFDMA-PHY parameters are discussed briefly in the following subsection.

4.4.1 OFDM-PHY

In this, FFT size is fixed and it is 256 bits in which number of used data subcarrier is 192, 8 pilot subcarriers to perform synchronization and channel estimation and 56 Null subcarriers [20]. The channel bandwidth for fixed WiMAX is 3.5 MHz but it varies due to spacing of subcarrier. Subcarrier spacing rises in higher bandwidth which decreases the symbol time eventually increases the delay spread. To avoid delay spreading, OFDM-PHY allocates a large fraction of guard space. For OFDM-PHY, the suitable symbol time is 64 μs, symbol duration is 72 μs and guard time spacing is 15.625 kHz[20].

4.4.2 OFDMA-PHY

In mobile WiMAX FFT size can varies between 128 and 2048 and to keep the subcarrier spacing at 10.94 KHz, the FFT size should be adjusted which is helpful to minimize Doppler spreads. Since there are different channel bandwidth like, 1.25, 5, 10 and 20 MHz etc, so FFT sizes are 128, 512, 1024 and 2048 respectively. For OFDMA-PHY, the suitable symbol time is 91.4 μs and the symbol duration is 102.9 μs and number of symbols in 5 ms frames is 48.0[20].

4.5 Sub-channelization

WiMAX divides the available subcarriers into several groups of subcarriers and allocates to different users based on channel conditions and requirement of users. This process is called sub-channelization. Sub-channeling concentrates the transmit power to different smaller groups of subcarrier to increase the system gain and widen up the coverage area with less penetration losses that cause by buildings and other obstacles. Without sub-channelization, the link budget would be asymmetric and bandwidth management would be poor[6]. Fixed WiMAX based OFDM-PHY permits a little amount of sub-channelization only on the uplink. Among 16 standard sub-channel, transmission can takes place in 1, 2, 4, 8 or all sets of sub-channels in the uplink of the SS. SS controls the transmitted power level up and down depending on allotted sub-channels. When the allotted sub-channels increase for uplink users, the transmitted power level increases and when the power level decreases, it means the allotted sub-channels decreased. The transmitted power level is always kept below the maximum level. In fixed WiMAX, to improve link budget and the performance of the battery of the SS, the uplink sub-channelization permits SS to transmit only a fraction of the bandwidth usually below 1/16 allocated by the BS[21].

Mobile WiMAX’s OFDMA-PHY permits sub-channelization in both uplink and downlink channels. The BS allocates the minimum frequency and sub-channels for different users based on multiple access technique. That is why this kind of OFDM is called OFDMA (Orthogonal Frequency Division Multiple Access). For mobile application, frequency diversity is provided by formation of distributed subcarriers. Mobile WiMAX has several distributed carrier based sub-channelization schemes. The mandatory one is called Partial Usage of Sub-Carrier (PUSC). Another sub-channelization scheme based on unbroken subcarrier is called Adaptive Modulation and Coding (AMC) in which multiuser diversity got the highest priority. In this, allocation of sub-channels to users is done based on their frequency response. It is a fact that, contiguous sub-channels are best suited for fixed and low mobility application, but it can give certain level of gain in overall system capacity[21].

1

Figure 4.7 illustrates the transmitted upstream OFDM spectrum from a CPE where the carriers are as same as BS in size and range but with small capacity[6].

4.6 BENEFITS AND DRAWBACKS of OFDM:

In the earlier section, we have stated that how an OFDM system combats the ISI and reduces the ICI. Besides those benefits, there are some other benefits as follows:

·         High spectral efficiency because of overlapping spectra

·         Simple implementation by fast fourier transform

·         Low receiver complexity as the transmitter combat the channel effect to some extends.

·         Suitable for high datar ate transmission

·         High flexibility in terms of link adaptation

·         Low complexity multiple access schemes such as orthogonal frequency division multiple access (OFDMA)

·         It is possible to use maximum likelihood detection with reasonable complexity[22].


On the other side, few drawbacks of OFDM are listed as follows

·         An OFDM system is highly sensitive to timing and frequency offsets[18] . Demodulation of an OFDM signal with an offset in the frequency can lead to a high bit error rate.

·         An OFDM system with large number of subcarriers will have a higher peak to average power ratio (PAPR) compared to single carrier system. High PAPR of a system makes the implementation of Digital to analog (DAC) and Analog to Digital Conversion (ADC) extremely difficult[23].

4.7 APPLICATION

OFDM has gained a big interest since the beginning of the 1990s[24]  as many of the implementation difficulties have been overcome. OFDM has been in used or proposed for a number of wired and wireless applications. Digital Audio Broadcasting (DAB) was the first commercial use of OFDM technology[23]. OFDM has also been used for the Digital Video Broadcasting[25] . OFDM under the acronym of Discrete Multi Tone (DMT) has been selected for asymmetric digital subscriber line (ADSL)[26]. The specification for Wireless LAN standard such as IEEE 802.11a/g[27-28] and ETSI HIPERLAN2[29] has employed OFDM as their PHY technologies. IEEE 806.16 standard for Fixed/Mobile BWA has also accepted OFDM for PHY technologies.

2

hb  is the height of the base station in meters (between 10 m and 80 m), d0 = 100 m, and a, b, c are constants dependent on the terrain category. These parameters are listed in the table below.

Table 5.1: Parameters of the ERCEG model

Model Parameter

Terrain Type A

Terrain Type B

Terrain Type C

a

4.6

4

3.6

b

0.0075

0.0065

0.005

c

12.6

17.1

20


s represents the shadowing effect and follows a lognormal distribution with a typical standard

deviation of 8.2 to 10.6 dB.

The above model is valid for frequencies close to 2 GHz and for receive antenna heights close to 2 m. For other frequencies and antenna heights (between 2 m and 10 m), the following correction terms are recommended :

4


5.2.2 SUI Models

This is a set of 6 channel models representing three terrain types and a variety of Doppler spreads, delay spread and line-of-sight/non-line-of-site conditions that are typical of the continental US as follows[31]:

Table 5.2: Terrain type and Doppler spread for SUI channel model

Channel

Terrain type

Doppler Spread

Spread

LOS

SUI-1

C

Low

Low

High

SUI-2

C

Low

Low

High

SUI-3

B

Low

Low

High

SUI-4

B

High

Moderate

High

SUI-5

A

Low

High

Low

SUI-6

A

High

High

Low

The terrain type A, B,C are same as those defined earlier for Erceg model. The multipath fading is modeled as a tapped delay line with 3 taps with non-uniform delays. The gain associated with each tap is characterized by a Rician Distribution and the maximum Doppler frequency. In a multipath environment, the received power r has a Rician distribution, whose pdf is given by:

5

Here, I0 (x) is the modified Bessel function of the first kind, zero order. A is zero if there is no LOS component and the pdf of the received power becomes:

6

This is the Raleigh distribution. The ratioK = A2/(2σ2) in the Rician case represents the ratio of

LOS component to NLOS component and is called the “K-Factor” or “Rician Factor.” For NLOS case, K-factor is zero and the Rician distribution reduces to Raleigh Distribution.

The general structure for the SUI channel model is as shown below in Figure 5.1. This structure is for Multiple Input Multiple Output (MIMO) channels and includes other configurations like Single Input Single Output (SISO) and Single Input Multiple Output (SIMO) as subsets. The SUI channel structure is the same for the primary and interfering signals.

Generic Structure of SUI Channel Models

        Figure 5.1:Generic Structure of SUI Channel Models

#  Input Mixing Matrix

This part models correlation between input signals if multiple transmitting antennas are used.

#  Tapped Delay Line Matrix

This part models the multipath fading of the channel. The multipath fading is modeled as a tapped delay line with 3 taps with non-uniform delays. The gain associated with each tap is characterized by a distribution (Rician with a K-factor > 0, or Raleigh with K-factor = 0) and the maximum Doppler frequency.

#Output Mixing Matrix

This part models the correlation between output signals if multiple receiving antennas are used. Using the above general structure of the SUI Channel and assuming the following scenario, six SUI channels are constructed which are representative of the real channels.

5.3 Scenario for modified SUI channels

Table 5.3: Scenario for SUI Channel Models

Cell size

7 KM

BTS Antenna Height

30 m

Receive Antenna Height

6 m

BTS Antenna Beam Width

120o

Receive Antenna Beam Width

Omni directional (360°) and 30°.

Polarization

Vertical Polarization Only

Cell coverage

90% cell coverage with 99.9% reliability at each location covered.

 5.4 Characteristics of SUI Channels:

In the following models, the total channel gain is not normalized. Before using a SUI model, the specified normalization factors have to be added to each tap to arrive at 0dB total mean power. The specified Doppler is the maximum frequency parameter. The Gain Reduction Factor (GRF) is the total mean power reduction for a 30° antenna compared to an Omni antenna. If 30oantennas are used the specified GRF should be added to the path loss. Note that this implies that all 3 taps are affected equally due to effects of local scattering. K-factors have linear values, not dB values. K-factors for the 90% and 75% cell coverage are shown in the tables, i.e., 90% and 75% of the cell locations have K factors greater or equal to the K-factor value specified, respectively. For the SUI channels 5 and 6, 50% K-factor values are also shown.

Table 5.4: Characteristic of SUI-1

SUI – 1 Channel


Tap 1

Tap 2

Tap 3

Units

Delay

0

0.4

0.9

μs


Power (omni ant.)

90% K-fact.(omni)

75% K-fact.(omni)


0

4

20


-15

0

0


-20

0

0

dB


Power (300 ant.)

90% K-fact.( 300)

75% K-fact.( 300)


0

16

72


-21

0

0


-32

0

0

dB

Doppler

0.4

0.3

0.5

Hz

Antenna Correlation:           ρENV = 0.7

Gain Reduction Factor:       GRF= 0 dB

Normalization Factor:    Fomni= -0.1771dB,

                                           F300  = -0.0371dB

Terrain Type:      C

Omni antenna:    τRMS = 0.111 μs

Overall K:K= 3.3(90%); K= 10.4(75%)

300 antenna:  τRMS = 0.042 μs

Overall K:K= 14.0(90%); K=44.2(75%)


 Table 5.5: Characteristic of SUI-2

SUI – 2 Channel


Tap 1

Tap 2

Tap 3

Units

Delay

0

0.4

1.1

μs


Power (omni ant.)

90% K-fact.(omni)

75% K-fact.(omni)


0

2

11


-12

0

0


-15

0

0

dB


Power (300 ant.)

90% K-fact.( 300)

75% K-fact.( 300)


0

8

36


-18

0

0


-27

0

0

dB

Doppler

0.2

0.15

0.25

Hz

Antenna Correlation:           ρENV = 0.5

Gain Reduction Factor:       GRF= 2 dB

Normalization Factor:    Fomni= -0.3930dB,

                                           F300  = -0.0768dB

Terrain Type:      C

Omni antenna:    τRMS = 0.202 μs

Overall K:K= 1.6(90%); K= 5.1(75%)

300 antenna:  τRMS = 0.069 μs

Overall K:K= 6.9(90%); K=21.8(75%)


Table 5.6:Characteristic of SUI-3

SUI – 3 Channel


Tap 1

Tap 2

Tap 3

Units

Delay

0

0.4

0.9

μs


Power (omni ant.)

90% K-fact.(omni)

75% K-fact.(omni)


0

1

7


-5

0

0


-10

0

0

dB


Power (300 ant.)

90% K-fact.( 300)

75% K-fact.( 300)


0

3

19


-11

0

0


-22

0

0

dB

Doppler

0.4

0.3

0.5

Hz

Antenna Correlation:           ρENV = 0.4

Gain Reduction Factor:       GRF= 3 dB

Normalization Factor:    Fomni= -1.5113dB,

                                           F300  = -0.3573dB

Terrain Type:      B

Omni antenna:    τRMS = 0.264 μs

Overall K:K= 0.5(90%); K= 1.6(75%)

300 antenna:  τRMS = 0.123 μs

Overall K:K= 2.2(90%); K=7.0(75%)

                        Table 5.7:Characteristic of SUI-4

SUI – 4 Channel


Tap 1

Tap 2

Tap 3

Units

Delay

0

1.5

4

μs


Power (omni ant.)

90% K-fact.(omni)

75% K-fact.(omni)


0

0

1


-4

0

0


-8

0

0

dB


Power (300 ant.)

90% K-fact.( 300)

75% K-fact.( 300)


0

1

5


-10

0

0


-20

0

0

dB

Doppler

0.2

0.15

0.25

Hz

Antenna Correlation:           ρENV = 0.3

Gain Reduction Factor:       GRF= 4 dB

Normalization Factor:    Fomni= -1.9218dB,

                                           F300  = -0.4532dB

Terrain Type:      B

Omni antenna:    τRMS = 1.257 μs

Overall K:K= 0.2(90%); K= 0.6(75%)

300 antenna:  τRMS = 0.563 μs

Overall K:K= 1.0(90%); K=3.2(75%)

                          Table 5.8: Characteristic of SUI-5

SUI – 5 Channel


Tap 1

Tap 2

Tap 3

Units

Delay

0

4

10

μs

Power (omni ant.)

90% K-fact.(omni)

75% K-fact.(omni)

50% K-fact.(omni)

0

0

0

2

-5

0

0

0

-10

0

0

0

dB

Power (300 ant.)

90% K-fact.( 300)

75% K-fact.( 300)

50% K-fact.( 300)

0

0

2

7

-11

0

0

0

-22

0

0

0

dB

Doppler

2

1.5

2.5

Hz

Antenna Correlation:           ρENV = 0.3

Gain Reduction Factor:       GRF= 4 dB

Normalization Factor:    Fomni= -1.5113dB,

                                           F300= -0.3573 dB

Terrain Type:      A

Omni antenna:    τRMS = 2.842 μs

Overall K:K= 0.1(90%); K=0.3(75%);K=1.0(50%)

300 antenna:  τRMS = 1.276 μs

Overall K:K= 0.4(90%); K=1.3(75%);K=4.2(50%)

                                        Table 5.9:Characteristic of SUI-6

SUI – 6 Channel


Tap 1

Tap 2

Tap 3

Units

Delay

0

14

20

μs

Power (omni ant.)

90% K-fact.(omni)

75% K-fact.(omni)

50% K-fact.(omni)

0

0

0

1

-10

0

0

0

-14

0

0

0

dB

Power (300 ant.)

90% K-fact.( 300)

75% K-fact.( 300)

50% K-fact.( 300)

0

0

2

5

-16

0

0

0

-26

0

0

0

dB

Doppler

0.4

0.3

0.5

Hz

Antenna Correlation:           ρENV = 0.3

Gain Reduction Factor:       GRF= 4 dB

Normalization Factor:    Fomni= -0.5683dB,

                                           F300  = -0.1184 dB

Terrain Type:      A

Omni antenna:    τRMS = 5.240 μs

Overall K:K= 0.1(90%); K= 0.3(75%);K=1.0(50%)

300 antenna:  τRMS = 2.370 μs

Overall K:K= 0.4(90%); K=1.3(75%);K=4.2(50%)

Chapter-6

Simulation Model

This chapter describes the simulation part of the thesis. A brief description of time and frequency division duplex is described first and then the simulation procedure is explained step by step with appropriate diagrams. We have employed Matlab 9.0 to develop the simulator. Before going for the physical layer setup, let us first define the OFDM symbol parameter used in our study.

 6.1 Physical Layer Setup

Basically physical layer handles error correction and signal connectivity, as well as registration, initial ranging, connectivity channels and bandwidth request for data and management. Physical layer consists of some sequence of equal length frames which transmit through modulation and coding of RF signals. OFDM technology has been using by WiMAX technology. Different user assigning different sub carries which are allowed in orthogonal frequency division multiplexing (OFDM) techniques. It is durable to multi-path which helps to overcome multipath signals hitting the receiver. OFDM signals divide into 256 carries in IEEE-802.16 standard and IEEE 802.16e use scalable OFDMA. Wide range of frequencies supported by IEEE 802.16 standard and physical layer contains several multiplexing and modulation forms. Modulation methods in the uplink (UL) and downlink (DL) are Binary Phase Shift Keying (BPSK), Quadrature Phase Shift Keying (QPSK) and Quadrature Amplitude Modulation (QAM).

Protocol Layer

Fig 6.1: IEEE 802.16 Protocol Layer (IEEE-2004)

WiMAX supports both full and half duplex. Two types of transmission supported by IEEE 802.16,

§  Time Division Duplex (TDD)

§  Frequency Division Duplex (FDD)

6.1.1 Time Division Duplex (TDD)

Time division duplex framing is adaptive (when input changes it output behavior is automatically change). It consists fixed duration which consists one downlink frame and uplink frame. Base station (BS) sends complete downlink (DL-MAP, UL-MAP). Up and Down link share same frequency but they are separated in time.

6.1.2 Frequency Division Duplex (FDD)

During transmission in frequency division, multi-path is scheduled by DL-MAP and UL-MAP. Downlink and uplink can be done in same time, but on different frequency. UL and DL channels grouped into some continuous blocks of some paired channel. FDD system provide full duplex where we can make some application like voice, where DL and UP traffic requirement need more or less symmetric. In Base station (BS) to base station interface kept in minimum, in this technique, network for radio communication planning is easier.

  Data Decoding

Block diagram  6.2 shows the whole process of the thesis work. Every part of the diagram is described below:

6.3 Transmitter Module

This subsection describes the transmitter module used for the simulation.

6.3.1 Mersenne Twister-Random Number Generator Algorithm

Mersenne Twister is a pseudo random number generator that produces a sequence of zeros and one bits. It might be combined into sub-sequences of zeros and ones or blocks of random numbers. There are two types of random number which is called deterministic and nondeterministic. We are dealing deterministic random numbers. A deterministic Random Number Generator (RNG) produces a sequence of bits from an initial value which is called seed. The seed value is 19,937 bits long and stored in 624 element array. The RNG algorithm has a period of 2**19937-1. A Pseudo Random Number Generator (PRNG) produces values based on a seed and current values. In our simulation we used this algorithm as function rand () to generate the random input value for evaluate the performance of WiMAX.

6.3.2 Modulation

We passed the random values through the adaptive modulation schemes according to the constellation mapped. The data was modulated depending their size and on the basis of different modulation schemes like BPSK, QPSK, 16-QAM and 64-QAM. The modulation has done on the basis of incoming bits by dividing among the groups of i. That is why there are 2i points. The total number of bits represented according to constellation mapped of different modulation techniques. The size of i for BPSK, QPSK, 16-QAM and 64-QAM is 1, 2, 4 and 16 respectively.

6.3.3 ReedSolomon Encoder

The randomized data are arranged in block format before passing through the encoder and a single 0X00 tail byte is appended to the end of each burst. The implemented RS encoder is derived from a systematic RS (N=255, K=239, T=8) code using GF (28). The following polynomials are used for code generator and field generator:

G(x) = (x+λ0)( x+λ0)… (x+λ2T-1), λ = 02HEX ———————————————(6.1)

p(x) = x8 + x4 + x3 + x2 + 1 —————————————————————-(6.2)

The encoder support shortened and punctured code to facilitate variable block sizes and variable error correction capability. A shortened block of k´ bytes is obtained through adding 239k´ zero bytes before

the data block and after encoding, these 239k´ zero bytes are discarded. To obtain the punctured pattern to permit T´ bytes to be corrected, the first 2T´ of the 16 parity bytes has been retained.

6.3.4 Convolutional Encoder

The outer RS encoded block is fed to inner binary convolutional encoder. The implemented encoder has native rate of 1/2, a constraint length of 7 and the generator polynomial in Equation (6.3) and (6.4) to produce its two code bits. The generator is shown in Figure 6.5.

G1 = 171OCT For X ——————————————————————————(6.3)

G2 = 133OCT For Y ——————————————————————————–(6.4)

Convolutional encoder

Figure 6.5: Convolutional encoder of rate ½

Table 6.1: Puncturing configuration of the convolution code

Rate

dFREE X output Y output XY(punctured output)

1/2

10 1 1 X1Y1

2/3

6 10 11 X1Y1Y2

3/4

5 101 110 X1Y1Y2X3

5/6

4 10101 11010 X1Y1Y2X3Y4X5


In order to achieve variable code rate a puncturing operation is performed on the output of the convolutional encoder in accordance to Table 6.1. In this Table “1” denotes that the corresponding convolutional encoder output is used, while “0” denotes that the corresponding output is not used. At the receiver Viterbi decoder is used to decode the convolutional codes.

6.3.5 Interleaver

RSCC encoded data are interleaved by a block interleaver. The size of the block is depended on the numbers of bit encoded per subchannel in one OFDM symbol, Ncbps. In IEEE 802.16, the interleaver is defined by two step permutation. The first ensures that adjacent coded bits are mapped onto nonadjacent subcarriers. The second permutation ensures that adjacent coded bits are mapped alternately onto less or more significant bits of the constellation, thus avoiding long runs of unreliable bits [1].

The Matlab implementation of the interleaver was performed calculating the index value of the bits after first and second permutation using Equation (6.5) and (6.6) respectively.

fk = (Ncbps/12).kmod12+floor(k/2) k = 0,1,2,… … ..Ncbps1 —   —————    –(6.5)

sk = s.floor(fk/s) + (mk +Ncbps –floor(12.mk/Ncbps))mod(s) k=0,1,2, Ncbps1  (6.6)

where s= ceil(Ncpc/2) , while Ncpc stands for the number of coded bits per subcarrier, i.e.,

1,2,4 or 6 for BPSK,QPSK 16-QAM, or 64-QAM, respectively.

The default number of subchannels i.e 16 is used for this implementation.

The receiver also performs the reverse operation following the two step permutation

using equations (6.7) and (6.8) respectively.

fj = s. floor(j/s)+(j+floor(12.j/Ncbps))mod(s)       j=0,1,… … ..Ncbps1 ———–(6.7)

sj = 12.fj – (Ncbps 1). floor(12.fj/Ncbps)            j=0,1,2… … .Ncbps1 ————(6.8)

6.3.6 Constellation Mapper

The bit interleaved data are then entered serially to the constellation mapper. The Matlab implemented constellation mapper support BPSK, QPSK, 16-QAM, and 64-QAM . The complex constellation points are normalized with the specified multiplying factor for different modulation scheme so  that equal average power is achieved for the symbols. The constellation mapped data are assigned to all allocated data subcarriers of the OFDM symbol in order of increasing frequency offset index.

6.3.7 IFFT

The OFDM symbol threats the source symbols to perform frequency-domain into time-domain. If we chose the N number of subcarriers for the system to evaluate the performance of WiMAX the basic function of IFFT receives the N number of sinusoidal and N symbols at a time. The output of IFFT is the total N sinusoidal signals and makes a single OFDM symbol. The mathematical model of OFDM symbol defined by IFFT which would be transmitted during our simulation as given bellow:

54

6.3.8 Subcarriers

In OFDM system, the carriers are sinusoidal. Two periodic sinusoidal signals are called orthogonal when their integral product is equal to zero over a single period. Each orthogonal subcarrier has an integer number of cycles in a single period of OFDM system. To avoid inter channel interference these zero carriers are used as a guard band in this system.

6.3.9 OFDM Symbol Description

In WiMAX Transmitter, IFFT (Inverse Fast Fourier Transform) used to create OFDM waveform with the help of modulated data streams. On the other hand in WiMAX receiver end the FFT used to demodulate the data streams. This time duration is defined to as symbol time, Tb. A copy of symbol period, Tg which is termed of Cyclic Prefix (CP) used to collect multipath where maintaining the orthogonality of the codes. The following fig 6.6 shows the OFDM symbol in the time domain.

1

In OFDM system, the number of sub-carriers is 256 which is equal to the FFT size. Each OFDM symbol consists of the following four types of carriers .

Data sub-carriers (OFDM) or sub-channels (OFDMA): used for data transmission

Pilot sub-carriers: used for various estimation purposes

DC sub-carriers: used as center frequency

Guard sub-carriers/Guard bands: used for keeping space between OFDM and OFDMA signals

The following fig 6.7 shows the OFDM symbol in frequency domain,

OFDM Symbol in frequency domain

Fig 6.7: OFDM Symbol in frequency domain [28]

To avoid Intersymbol Interference (ISI) the Cyclic Prefix (CP) is inserted in OFDM system before each transmitted symbol. In wireless transmission the transmitted signals might be distort by the effect of echo signals due to presence of multipath delay. The ISI is totally eliminated by the design when the CP length is greater than multipath delay. After performing Inverse Fast Fourier Transform (IFFT) the CP will be add with each OFDM.

6.3.10 CP Insertion

To maintain the frequency orthogonality and reduce the delay due to multipath propagation, cyclic prefix is added in OFDM signals. To do so, before transmitting the signal, it is added at the beginning of the signal. In wireless transmission the transmitted signals might be distort by the effect of echo signals due to presence of multipath delay. The ISI is totally eliminated by the design when the CP length L is greater than multipath delay. After performing Inverse Fast Fourier Transform (IFFT) the CP will be add with each OFDM symbol.

6.4 Channel Module / Wireless Channel

In wireless communication, the data are transmitting through the wireless channel with respective bandwidth to achieve higher data rate and maintain quality of service. The transmitting data has to take environmental challenges when it is on air with against unexpected noise. That’s why data has to encounter various effects like multipath delay spread, fading, path loss, Doppler spread and co-channel interference. These environmental effects play the significant role in WiMAX Technology. To implement an efficient wireless channel have to keep in mind the above fact. In this section we are presenting the wireless channels.

  • Additive White Gaussian Noise (AWGN)
  • Rayleigh Fading Channel
  • Stanford University Interim (SUI)

6.4.1 Additive White Gaussian Noise (AWGN)

This is a noise channel. This channel effects on the transmitted signals when signals passes through the channel. This noise channel model is good for satellite and deep space communication but not in terrestrial communication because of multipath, terrain blocking and interference. AWGN is used to simulate background noise of channel. The mathematical expression as in received signal r(t) = s(t) + n(t) is shown in figure 6.8 which passed through the AWGN channel where s(t) is transmitted signal and n(t) is background noise.

AWGN Channel

Fig 6.8: AWGN Channel

6.4.2 Rayleigh Fading Channel

Rayleigh Fading is one kind of statistical model which propagates the environment of radio signal. According to Rayleigh distribution magnitude of a signal which has passed though the communication channel and varies randomly. Rayleigh Fading works as a reasonable model when many objects in environment which scatter radio signal before arriving of receiver. When there is no propagation dominant during line of sight between transmitter and receiver on that time Rayleigh Fading is most applicable. On the other hand Rician Fading is more applicable than Rayleigh Fading when there is dominant line of sight. During our simulation we used Rayleigh Fading when we simulate the performance of Bit Error Rate Vs Signal to Noise Ratio.

6.5 Receiver Module

Omni directional Antenna is the most popular antenna in WiMAX, which can be used for point-to-multipoint configuration. The main feature of Omni Directional antenna is that, it can be deployed broad-casting in 3600 angle. This is the limitation of its range and ultimately it shows its signed strength. Omni directional antennas are mostly user friendly when lots of subscribers stay very close to the base station.

6.5.1 CP Removal

In transmitting module, to deal the frequency orthogonality and reduce the delay, cyclic prefix added in each OFDM signals. That’s why, before transmitting the signal, the CP added at the beginning of the signal. After performing Inverse Fast Fourier Transform (IFFT) the CP will be add with each OFDM symbol. In receiver module, after synchronization the received data contains the Cyclic Prefix of each OFDM signal which is ignored.

6.5.2 FFT

By using number of samples FFT converts time domain signal into frequency domain signal. The FFT frequency domain signal defined as 1/ Ts_tot (where Ts_tot is total number of samples). In transmitter module, IFFT converts the OFDM signals from frequency domain to time domain which is exactly reverse work of FFT. To perform of OFDM 256 points, the zeros are padded beginning and ending of the OFDM signal. These zero pads will be removed from the corresponding places at the receiving module.

6.5.3 Channel Equalizer

In our simulation we used Zero-Force Bock Equalizer (ZFE) and Minimum Mean Square Equalizer (MMSE) which are described below.

  • Zero-Force Block Equalizer (ZFE)

Zero force channel equalizer removes the output of equalizer Inter symbol interference (ISI) from the channel. This equalizer works as a noise remover but if the channel has no noise then it remain ideal condition.

Block Diagram of a Simple Transmission

Fig 6.9: Block Diagram of a Simple Transmission in Zero-Force Equalizer

34

6.5.4 Demodulation

Demodulation works to extract the original data from a modulated waveform. At the receiver, an electronic circuit works to recover the different base-band signals which have already transmitted from the transmitter end which is called demodulator [30].

Chapter 7

Simulation Results

  In this chapter the simulation results are shown and discussed. In the following sections, first we will present the structure of the implemented simulator and then we will present the simulation results.

7.1 Bit Error Rate (BER)

When number of bits error occurs within one second in transmitted signal then we called Bit Error Rate (BER). In another sentence Bit Error rate is one type of parameter which used to access the system that can transmit digital signal from one end to other end. We can define BER as follows,5

If transmitter and receiver’s medium are good in a particular time and Signal-to-Noise Ratio is high, then Bit Error rate is very low. In our thesis simulation we generated random signal when noise occurs after that we got the value of Bit error rate.

7.2 SNR

Energy per bit to noise power spectral density ratio is important role especially in simulation. Whenever we are simulating and comparing the Bit Error rate (BER) performance of adaptive modulation technique is very necessary Eb/N0. The normalized form of Eb/N0   is Signal-to- Noise Ratio (SNR). In telecommunication, Signal-to-Noise ratio is the form of power ratio between a signal and background noise,

6

Here P is mean power. In this case the signal and the background noise are measured at the same point of view if the measurement will take across the same impedance then SNR would be obtained by measuring the square of the amplitude ratio.

7

7.3 BER Vs SNR

The Bit Error Rate (BER) defined as the probability of error (Pe). On the other hand Signal-to- Noise is the term of power ratio between a signal and background noise. There are three variables like,

  • The error function (erf)
  • The energy per bit (Eb)
  • The noise power spectral density (N0)


Every modulation scheme has its own value for the error function. That is why each modulation scheme performs in different manner due to the presence of background noise. For instance, the higher modulation scheme (64-QAM) is not robust but it carries higher data rate. On the contrary, the lower modulation scheme (BPSK) is more robust but carries lower data rate. The energy per bit, Eb defined by dividing the carrier power and measured of energy with the unit of Joules. Noise power spectral density (N0) is power per hertz with the unit of Joules per second. So, it is clear that the dimension of SNR is cancelled out. So we can agree on that point that, the probability of error is proportional to Eb/N0.


7.4 Physical layer performance results


The basic goal of this thesis is to analyze the performance of WiMAX OFDM physical layer based on the simulation results. In order to analyze, the BER Vs SNR plot was investigated.

SUI-1 BER over SNR for BPSK

              Fig 7.1: SUI-1 BER over SNR for BPSK

SUI-1 BER over SNR for QPSK

   Fig 7.2: SUI-1 BER over SNR for QPSK

SUI-1 BER over SNR for 16-QAM

Fig 7.3: SUI-1 BER over SNR for 16-QAM

SUI-1 BER over SNR for 64-QAM

Fig 7.4: SUI-1 BER over SNR for 64-QAM

SUI-2 BER over SNR for BPSKSUI-2 BER over SNR for 16-QAMSUI-2 BER over SNR for 64-QAMSUI-3 BER over SNR for QPSKSUI-3 BER over SNR for 64-QAMSUI-4 BER over SNR for BPSKSUI-4 BER over SNR for 16-QAMSUI-5 BER over SNR for BPSKSUI-5 BER over SNR for BPSKSUI-6 BER over SNR for BPSK

SUI-6 BER over SNR for 64-QAM

7.5 Conclusion :

After all conditions we applied and the results we got we can conclude our work as follows,

  • We studied WiMAX OFDM physical layer, mobile systems, modulation techniques and features of WiMAX networks properly, with the help of necessary figures and tables.
  • We studied SUI-1 to SUI-6 channel model and also implemented it through Matlab simulation to evaluate the performance of Mobile WiMAX.
  • We also used and understood the adaptive modulation techniques like, BPSK, QPSK, 16-QAM and 64-QAM according to IEEE 802.16d standard.

In all aspects of adaptive modulation technique, we can conclude the performance of Mobile WiMAX as,

  • Binary Phase Shift Keying (BPSK) is more power efficient and needs less bandwidth.
  • On the other hand 64-Qadrature Amplitude Modulation (64-QAM) has higher bandwidth with very good output.
  • In another case, Quadrature Phase Shift Keying (QPSK) and 16-QAM modulation techniques are in middle of those two (BPSK and 64-QAM) and they requires higher bandwidth.
  • QPSK and 16-QAM are less power efficient than BPSK.
  • During all simulations we got, BPSK has the lowest BER and 64-QAM has the highest BER than other modulation techniques.

We also add some more things in here,

  • We included Cyclic Prefix (CP) and random signals which reduced noise resulting lower Bit error Rate (BER) for OFDM system but increased the complexity in the system.
  • Cyclic Prefix requires higher power but non Cyclic Prefix requires lower power.

7.6 Future Work:

A lot of works can be done for future optimization of Wireless communication especially in WiMAX system. Adaptive modulation techniques and WiMAX physical layer can be adopted with High Amplitude Platform (HAP) and Long Term Evaluation (LTE).

The implemented PHY layer model still needs some improvement. The channel estimator can be implemented to obtain a depiction of the channel state to combat the effects of the channel using an equalizer. The IEEE 802.16 standard comes with many optional PHY layer features, which can be implemented to further improve the performance. The optional Block Turbo Coding (BTC) can be implemented to enhance the performance of FEC. Space Time Block Code (STBC) can be employed in DL to provide transmit diversity.


read more
EEE

Assignment on Photovoltaic System

Status of Photovoltaic System Designs

Major categories of PV system designs include grid-connected without storage, grid-connected with storage, and off-grid.

Grid-Connected with No Storage

The major elements of a grid-connected PV system that does not include storage are shown in Figure 2-1. The inverter may simply fix the voltage at which the array operates, or (more commonly) use a maximum power point (MPP) tracking function to identify the best operating voltage for the array. The inverter operates in phase with the grid (unity power factor), and generally delivers as much power as it can to the electric power grid given the sunlight and temperature. The inverter acts as a current source; it produces a sinusoidal output current but does not act to regulate its terminal voltage in any way.

The utility connection can be made by connecting to a circuit breaker on a distribution panel or by a service tap between the distribution panel and the utility meter. Either way, the PV generation reduces the power taken from the utility power grid, and may provide a net power flow into the utility power grid if the interconnection rules permit.

PV power system

Figure (31): Grid-connected PV power system with no storage

A simplified equivalent circuit of the same basic grid-connected system is shown in Figure 2-2. The PV system typically appears to the grid as a controlled current source, local loads may consist of resistive, inductive, and capacitive elements, and the utility source is represented by its Thevenin-equivalent model (voltage source Utility V with series impedance Utility Z). The local loads within a single residence rarely include much capacitance, but if a whole neighborhood is modeled at once, voltage support capacitors maintained by the utility may contribute significantly to the local load mix. This leads to conditions that could fool the inverter into running, even if the utility becomes disconnected (unintentional islanding). The utility source impedance models such things as the impedances of transformers and cables. The inverter handles all grid interface functions (synchronization, over/under voltage [OV/UV] and over/under frequency [OF/UF] disconnects, anti-islanding) and PV array control functions (MPP tracking)

PV system

Figure (32): Schematic drawing of a modern grid-connected PV system with no storage.

The ratio of PV system size to local load demand may be small enough that reverse power flow from the PV to the utility never occurs, but at high penetration the magnitude of the reverse power flow at midday is likely to exceed the magnitude of the nighttime load power. As shown in Figure (32), if we try to make the generation energy (area of red hump) equal to the load energy (blue area), the daytime power production (peak of red generation hump at solar noon) is likely to exceed the peak load power flow because most loads draw power all night when the PV system cannot supply power. For this residential load example, the peak load power flow is a double peak in late evening, which highlights the time misalignment that can occur between residential load and PV generation. Fortunately, commercial loads peak in the early afternoon, so the total PV generation in a utility system can reduce the peak system load, even though it may have no impact on the peak load at the residence where the PV is installed.

PV energy

Figure (33): Power flows required to match PV energy generation with load energy consumption.

As part of this work, an extensive literature search was conducted to assess the current body of knowledge of expected problems associated with high penetration levels of grid-tied PV. The results of that literature survey are presented here.

Several studies have been conducted to examine the possible impacts of high levels of utility penetration of this type of PV system. One of the first issues studied was the impact on power system operation of PV system output fluctuations caused by cloud transients. A 1985 study in Arizona examined cloud transient effects if the PV were deployed as a central-station plant and found that the maximum tolerable system-level penetration level of PV was approximately 5%. The limit was imposed by the transient following capabilities (ramp rates) of the conventional generators. Another paper published in that same year [63] about the operating experience of the Southern California Edison central station PV plant at Hesperia, California, reported no such problems, but suggests that this plant had a very stiff connection to the grid and represented a very low PV penetration level at its point of interconnection.

In 1989, a paper describing a study on harmonics at the Gardner, Massachusetts, PV project was released [64]. The 56 kilowatts (kW) of PV at Gardner represented a PV penetration level of 37%, and the inverters (APCC Sun Shines) were among the first generation of true sine wave pulse width modulation inverters. All the PV homes were placed on the end of a single phase of a 13.8 kV feeder. This was done intentionally:

Selection of the houses comprising the Gardner Model PV Community was predicated on establishing a high saturation of inverters as may become typical on New England distribution feeders in the next century.

The impact of high penetrations of PV on grid frequency regulation appeared in a 1996 paper from Japan [65]. This study used modeled PV systems that respond to synthetically generated short-term irradiance transients caused by clouds. The study looked at system frequency regulation and the break even cost, which accounts for fuel savings when PV is substituted for peaking or base load generation and PV cost. This paper reaches three interesting conclusions: (1) the break-even cost of PV is unacceptably high unless PV penetration reaches 10% or so; (2) the thermal generation capacity used for frequency control increases more rapidly than first thought; and (3) a 2.5% increase in frequency control capacity over the no-PV case is required when PV penetration reaches 10%. For PV penetration of 30%, the authors found that a 10% increase in frequency regulation capacity was required, and that the cost of doing this exceeds any benefit. Based on these two competing considerations, the authors conclude that the upper limit on PV penetration is 10%.

Between 1996 and 2002, a series of reports was produced by an International Energy Agency working group on Task V of the Photovoltaic Power Systems Implementing Agreement. Unintentional islanding, capacity value, certification requirements, and demonstration project results were all the subjects of reports, but the one that is of primary importance here dealt with voltage rise. This report focused on three configurations of high-penetration PV in the low-voltage distribution network (all PV on one feeder, PV distributed among all feeders on a medium-voltage/low-voltage (MV/LV) transformer, and PV on all MV/LV transformers on an MV ring). This study concludes that the maximum PV penetration will be equal to whatever the minimum load is on that specific feeder. That minimum load was assumed to be 25% of the maximum load on the feeder in [66], and if the PV penetration were 25% of the maximum load, only insignificant over voltages occurred. Any higher PV penetration level increased the over voltages at minimum loading conditions to an unacceptable level. This study assumed that the MV/LV transformers do not have automatic tap changers (they are assumed to have manually set taps). [66]

Grid-Connected with Storage:


Figure 2-4 shows two basic storage architectures commonly found with grid-connected PV systems. (a) Shows an architecture that many older systems have used, where a separate battery charge control device controls power collected from the PV array. This arrangement leaves the inverter to provide backup battery charge control from the utility power grid when insufficient PV power is available, but does not allow efficient extraction of excess PV power for supply to the grid when the batteries are fully Figure 2-4charged. Figure 2-4(b) shows an architecture that is more common in modern grid-connected PV power systems that allows the PV array power to be directed optimally by the inverter to batteries or the utility power grid as appropriate.

pv system 2 pv system 1

Figure (34): Grid-connected PV systems with storage using (a) separate PV charge control and inverter charge control, and (b) integrated charge control.

In both cases, storage provides the opportunity to supply power to critical loads during a utility outage. This feature is not available without storage.

As with the grid-connected only configuration described previously, PV generation reduces the power taken from the utility power grid, and may in fact provide a net flow of power into the utility power grid if the interconnection rules permit. Storage has been traditionally deployed for the critical load benefit of the utility customer in the United States, but the Ota City High Penetration PV project [67] deployed local storage as an alternate destination for energy collected during low load periods to prevent voltage rise from reverse power flow in the distribution system.


Off-Grid with Storage:


Off-grid PV systems may include electricity or other storage (such as water in tanks), and other generation sources to form a hybrid system. Figure 2-5 shows the major components of an off-grid PV system with electricity storage, no additional generators, and AC loads. In a system of this type, correctly sizing the energy storage capacity is a critical factor in ensuring a low loss-of-load probability [68].PV system with storage

Figure (35) : Off-grid PV system with storage

In this system configuration, the inverter acts as a voltage source, which is in contrast to the grid-tied system. The stand-alone inverter determines the voltage wave shape, amplitude, and frequency. To maintain the voltage, the inverter must supply current surges, such as those demanded by motors upon startup, and whatever reactive power is demanded by the loads.

Many stand-alone PV systems include engine-generator sets. In most cases, the generators are thought of as backup generators that are operated only during periods of low sunlight or excessive load that deplete the energy storage to some minimum allowed state of charge. The inverter senses a low battery voltage condition and then starts the generator. The generator usually produces 60-hertz (Hz) AC power directly, and thus when it starts, it powers the loads directly (the power to the loads does not pass through the inverter). The inverter operates as a rectifier and battery charger, drawing generator power to recharge the batteries. The system continues in this mode until the batteries are recharged. The generator is then stopped, and the inverter resumes regulation of the AC bus voltage, drawing power from the PV and batteries.


Energy Payback System for PV:

Producing electricity with photovoltaic’s (PV) emits no pollution, produces no greenhouse gases, and uses no finite fossil-fuel resources. The environmental benefits of PV are great. But just as we say that it takes money to make money, it also takes energy to save energy. The term “energy payback” captures this idea. How long does a PV system have to operate to recover the energy—and associated generation of pollutions and CO2—that went into making the system, in the first place?

Energy payback estimates for both rooftop and ground-mounted PV systems are roughly the same, depending on the technology and type of framing used. Paybacks for multicrystalline modules are 4 years for systems using recent technology and 2 years for anticipated tech­nology. For thin-film modules, paybacks are 3 years using recent technology, and just 1 year for anticipated thin-film technology (see Figure 1). With assumed life expectancies of 30 years, and taking into account the fossil-fuel-based energy used in manufacture, 87% to 97% of the energy that PV systems generate won’t be plagued by pollution, greenhouse gases, and depletion of resources

Based on models and real data, the idea that PV cannot pay back its energy investment is simply a myth. Indeed, researchers Dones and Frischknecht found that PV-systems fabrication and fossil-fuel energy production have similar energy payback periods (including costs for mining, transportation, refining, and construction. [69]


Energetic Performance of PV System:

Yield Calculation and Monitoring

Yield and Losses

A grid-connected PV system consists mainly of a PV array and an inverter. In order to evaluate the energetic performance of such a system, the energy yield and losses at the different conversion performance of such a system, the energy yield and losses at the different conversion steps are normalized to the power values under STC. The method and nomenclature as it is introduced here is common practice in PV system engineering [70, 71]. Yield and losses can be allocated to the different components of a grid-connected PV system as shown in the figure ( ).

The reference yield is defined as solar irradiation on the tilted plane normalized to the solar irradiance under STC, hence,

1

It is expressed in hours or “kWh / kWp”.

Array yield  and final yield Y are calculated by normalizing the energy before, respectively, after passing the inverter, to the rated power of the Pv array under STC.

In practice, these values are mostly given in “  kWh / kWp ”. Accordingly, the capture loses and system losses are calculated as

2

The term system losses may be misleading. It originates from Stand-alone and hybrid PV systems and includes all losses that are not capture losses. For a grid-connected PV installation, the system losses are mainly inverter losses.

Yield and losses as defined above are usually calculated either as annual values or as daily mean values during a specified period such as a day, month or year. Nevertheless, analogues figure can be calculated based on instantaneous irradiance and

grid-connected PV system

Figure (36): Energy flow in a grid-connected PV system.


Power instead of irradiation and energy in the literature it has been proposed the same nomenclature but with lower case letters for analysis of the power flow in PV system [71].

In order to Assess and compare the performance of PV system over several years and for different sites, independently of  variations of the solar recourses, array yield and final yield are normalized to the reference yield. The performance ratio is defined as

4

It can be interpreted as the ratio between the actual system yield and the yield of an ideal system, always operating with the conversion efficiency of the PV array under STC.

A performance database of PV systems Worldwide is maintained within the International Energy Agency’s Photovoltaic Power System Programme (IEA PVPS).While PV system installed in Germany before 1995 exhibits performance ratio is 0.74[70]. The development can be explained by learning effects in PV system engineering during the national 1000-Roof-PV-Programme, running from 1991 to 1994 [71]. The mean performance ratio of PV system in Japan installed in the 1990s is situated around 0.73 and it is not much varying over the years [76]. In the Belgian project for PV at schools, the mean performance ratio of all system in 1990 was 0.70 [77].

Common to all monitoring programmers was a very high spread of the Annual performance ratio among the installation. The IEA PVPS conclude on this basis that via further optimization “average annual PR values of higher than 0.75 are to be achieved for well-planned PV system.”[70]

By assuming a realistic performance ratio, the Annual final yield for a given site can be estimated based on long-term mean values of solar irradiation. Table 2 shows irradiation and expectably yield values for different sites in Belgium.

A low performance ratio can be either due to shadowing of the PV array or to flaws in the system design. Typical causes for a bad performances are inverter failure, a low inverter efficiency, increase arrays temperature due to bad ventilation of the arrays back side or exaggerated module reduction in yield is tolerated many cases. Nevertheless, addition electrical losses can occur as a consequence of PV module and string mismatch with partial shadowing. Yet, these losses can be minimized already in the planning phase, if the array arrangement is Adapted to the particular shadowing situation


Monitoring:

The monitoring of photovoltaic system in Europe should follow IEC 61724 [79] and the guidelines of the European Commission [70]. These guidelines are meant to define “a minimum set of quantities as well as standards recording techniques” [70]. Additional requirements may be specified as, for example, in Dutch guideline for PV monitoring system

The guideline of the European Commission distinguish between “analytical monitoring” and “Global monitoring”[70]. For global monitoring, the integral values of reference yield, array yield and final yield are manually recorded for periods of one month of shorter, Global monitoring is usually applied in order to verify the trouble free operation of a PV system based on the energy balance. Conversely, analytical monitoring is necessary in order to study the system performance in detail. Analytical monitoring is necessary in order to draw. Conclusions regarding yield reductions and the potential for future improvements.

Analytical monitoring includes the measurement of the system voltage, the current, and the power on the DC and AC side of the inverter. Moreover, the measurement of the ambient temperature is required. Although not required in [69], often in the individual string current are measured and the PV cell temperature via the modules back side. The precision of the Data should be within 2% of full scale, that is, class 2. According to[70] the data must be recorded as hourly averages, sampled at one value per minute at least. In the Dutch guidelines [, ten minute average are required, sampled at one per second. In the recent Japanese monitoring programme even one –minute averages are recorded.

read more